GENERAL ECONOMIC CONDITIONS
GLOBAL ECONOMY
According to the Winter forecast of the Kieler Institut für Weltwirtschaft (ifw Kiel – Kiel Institute for World Economics) of December 13, 2017 the expansion of the global economy saw an evident acceleration in 2017. The solid upswing is a result of the economy in virtually all the large national economies taking an upward trajectory. In this process, GDP growth in advanced economies has reached a high level, but the economic situation has also considerably improved in emerging countries. Global GDP rose by 3.8% in 2017. Growth therefore amounted to 0.3 percentage points above the previous year’s forecast (2016 Winter forecast) or 0.2 percentage points over the 2017 Summer forecast. This represents the strongest increase in global GDP since 2011. The large-scale expansion of foreign trade in Asia and the considerable increase of investments due to favorable investment conditions was particularly crucial for this global revival.
SPORTING GOODS INDUSTRY
Increased consumer spending due to greater income, both in emerging countries and in advanced economies, led to considerable growth in the sporting goods industry in 2017. Among other things, the increase in health consciousness across the world and the associated rise in sporting activity was crucial for this development. The trend toward more and more women being active in sports contributed to this positive performance. Moreover, the global sports fashion trend continued.
With regard to distribution channels, it was observed that the eCommerce business continued to expand rapidly. Various commercial opportunities, such as mobile technologies and social media were used for this purpose. Nevertheless, the sporting goods industry faced some challenges in individual markets in 2017, such as the continued consolidation among retail stores in the United States.
SALES
ILLUSTRATION OF SALES DEVELOPMENT IN 2017 COMPARED TO THE OUTLOOK
In the 2016 Annual Report, PUMA forecast a currency-adjusted increase in consolidated sales in the high single-digit percentage range for the financial year 2017. This forecast was increased several times throughout the year and PUMA now expects a currency-adjusted sales increase of between 14% and 16% for financial year 2017. PUMA was able to reach the upper end of the adjusted forecast in 2017, thereby exceeding the original sales growth target significantly.
More details on sales development are provided on the next page.
CONSOLIDATED SALES
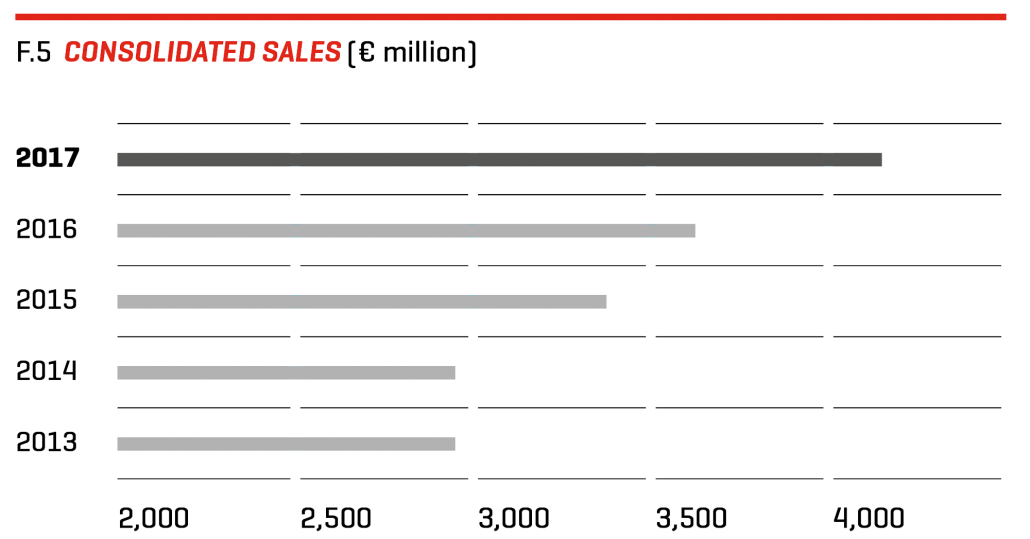
PUMA increased consolidated sales in the financial year 2017 in euro, the reporting currency, by 14.0% to € 4,135.9 million. Currency-adjusted sales increased by 15.9%. For the first time, PUMA has therefore been able to exceed the symbolic sales mark of four billion euros. All regions contributed to this positive development with double-digit growth rates. The footwear segment was the main growth driver.
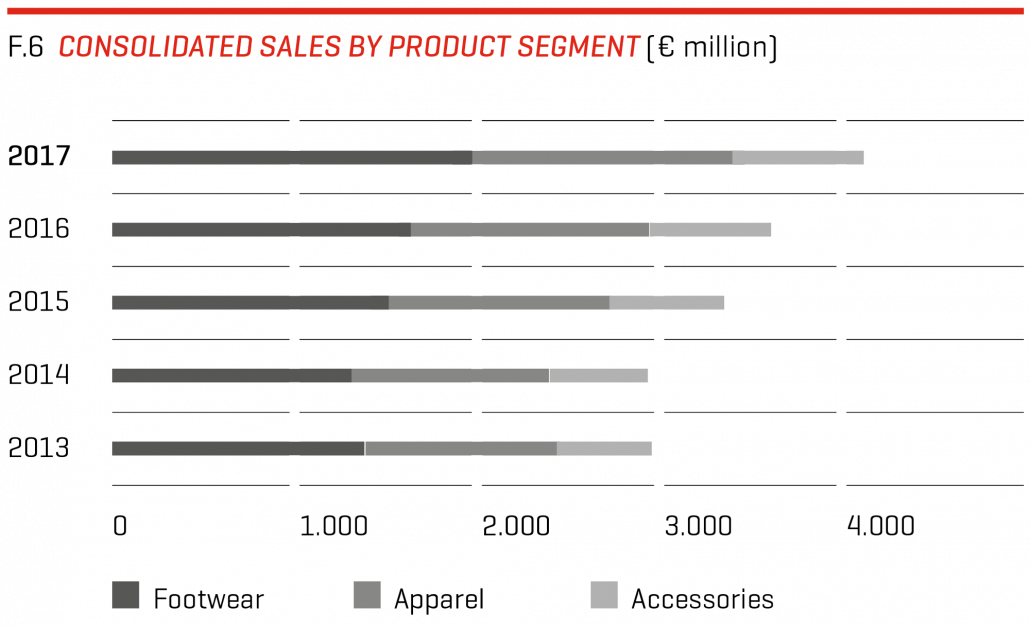
The most important segment for PUMA – footwear – recorded a growth trend persistent for 14 quarters at the end of financial year 2017. The strongest growth was therefore achieved in the Running and Training and Sportstyle categories. Sales increased in the reporting currency, the euro, by 21.4% to € 1,974.5 million. Currency-adjusted sales growth of 23.5% was achieved. This segment’s share in consolidated sales rose from 44.9% in 2016 to 47.7% in the reporting year
In the apparel segment, sales increased in the reporting currency, the euro, by 8.1% to € 1,441.4 million. Currency-adjusted, sales grew by 10.0%. The Sportstyle category, in particular products for women, contributed to this increase in sales. The apparel segment accounted for 34.9% of consolidated sales (previous year: 36.8%).
In the accessories segment, sales increased in the reporting currency, the euro, by 8.0% to € 719.9 million. This correspond to a currency-adjusted increase of 9.2%. The increase results from increased sales in the areas of socks and underwear, while sales of golf clubs remained almost stable in the reporting year. The share of consolidated sales decreased to 17.4% (previous year: 18.4%).
RETAIL BUSINESSES
The company’s own retail store activities include PUMA stores, factory outlets and online sales, each with direct sales to our customers (direct-to-customer business). In addition to regional availability, they ensure controlled sales of PUMA products and the presentation of the PUMA brand in an environment suitable for our market positioning.
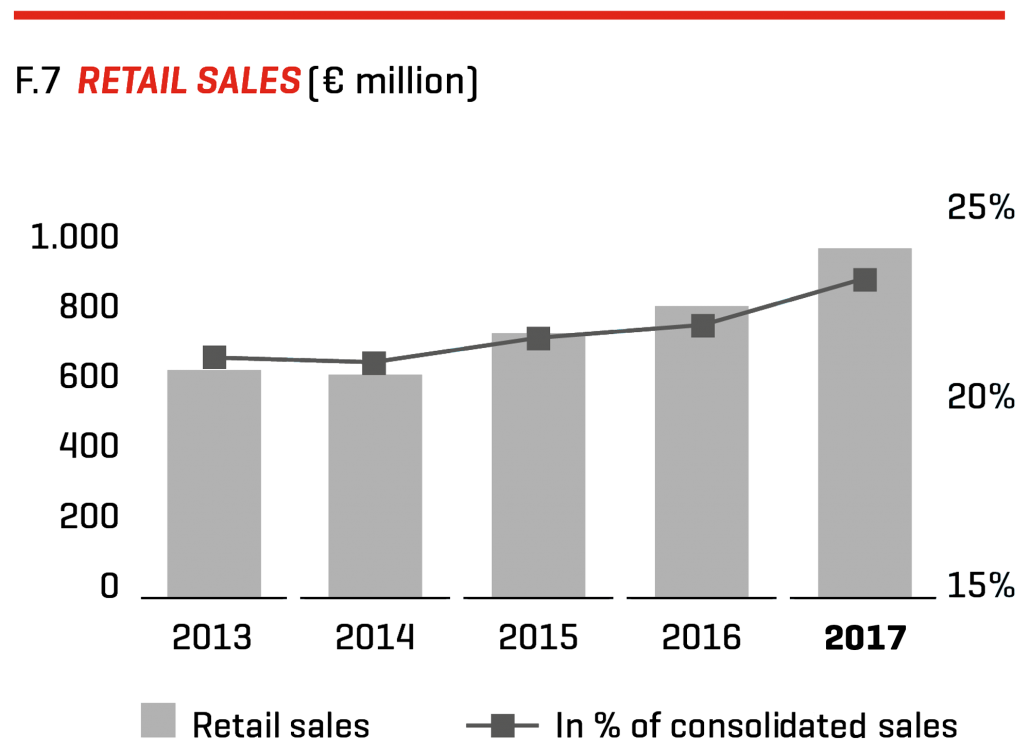
The sales of the Company’s own retail store activities improved in financial year 2017, currency-adjusted by 22.9% to € 961.0 million. This corresponds to a share of 23.2% of total sales (previous year: 21.9%). The sales growth was achieved both on a comparable area basis in our own retail stores and through the targeted expansion of the portfolio of the company’s own retail stores. In addition to the opening of additional retail stores, optimizing the portfolio also included modernizing existing retail stores in line with the Forever Faster store concept. This makes it possible to present PUMA products and related technologies in an even more attractive environment and strengthens PUMA’s position as a sports brand.
The eCommerce business recorded above-average growth due to the expansion of the product range in the online stores as well as the relaunch of www.PUMA.com in a more modern and mobile format. Our sales promotions on special days in the online business such as, for example, on November 11, Singles’ Day in China and also the biggest online shopping day in the world, known as Black Friday, turned out to be particularly successful. In addition, the introduction of our new products and collections, for example FENTY PUMA by Rihanna, resonated extraordinarily with our online customers.
LICENSING BUSINESS
For various product segments, such as fragrances, eyewear and watches, PUMA issues licenses authorizing independent partners to design, develop, manufacture and sell these products. Revenue from license agreements also includes some sales licenses for various markets.
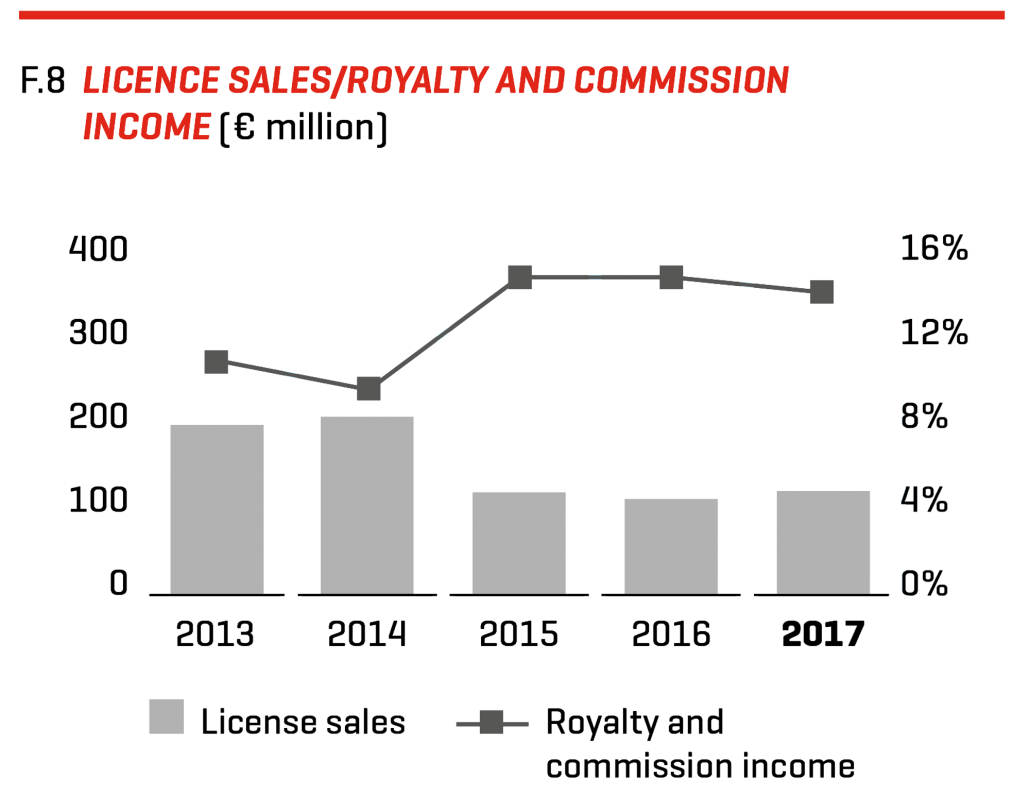
Licensing sales increased in 2017 in the reporting currency, the euro, by 8.8% (currency-adjusted by 9.3%) to € 113.5 million. The resulting royalty and commission income was € 15.8 million (previous year: € 15.7 million).
ILLUSTRATION OF EARNINGS DEVELOPMENT IN 2017 COMPARED TO THE OUTLOOK
In the outlook of the 2016 Annual Report, PUMA forecasted a slight improvement in the gross profit margin to around 46.0% for financial year 2017. PUMA expected an increase in a mid-to-high single-digit percentage rate for other operating income and expenses. The forecast for the operating income (EBIT) was within a range of between € 170 million and € 190 million. Furthermore, a significant improvement in consolidated net earnings was expected.
These forecasts were increased several times throughout the year due to the better-than-expected business development and PUMA now expects an improvement in the gross profit margin to approximately 46.5%, an increase in other operating income and expenses in the low double-digit percentage area and an operating result (EBIT) within a range of between € 235 million and € 245 million. In accordance with previous forecasts, management continued to expect a significant improvement in consolidated net earnings in 2017.
PUMA was able to fully reach the increased forecasts in 2017 and even slightly exceed them with regard to the gross profit margin. As a result, PUMA was able to considerably exceed the improvement in operating income and in operating margin that were the original target for 2017.
More details on earnings development are provided on the next pages.
GROSS PROFIT MARGIN
In the financial year 2017, gross profit increased by 18.0% from € 1,656.4 million to € 1,954.3 million.
The gross profit margin increased by 160 base points from 45.7% to 47.3%, as PUMA was able to more than compensate for the negative currency exchange effects based on the weakness of individual currencies against the US dollar through improvements in sourcing, higher sales of new products with higher margins, a higher share of its own retail store sales and selective price adjustments.
The gross profit margin in the footwear segment increased considerably from 42.5% in the previous year to 45.5%. The apparel gross profit margin increased from 48.4% to 49.0% and in accessories it increased from 47.9% to 48.5%.
OTHER OPERATING INCOME AND EXPENSES
The consistent focus on the strict monitoring of other operating income and expenses continued to be top priority for PUMA in financial year 2017.
Nevertheless, further investment was made in a targeted manner in marketing so as to increase PUMA’s brand heat and to position PUMA as the fastest sports brand in the world. Likewise, there was continued investment in modernizing the Company’s own retail stores. The opening of new retail stores contributed to the increase in other operating income and expenses. Furthermore, progress was made in modernizing our IT infrastructure.
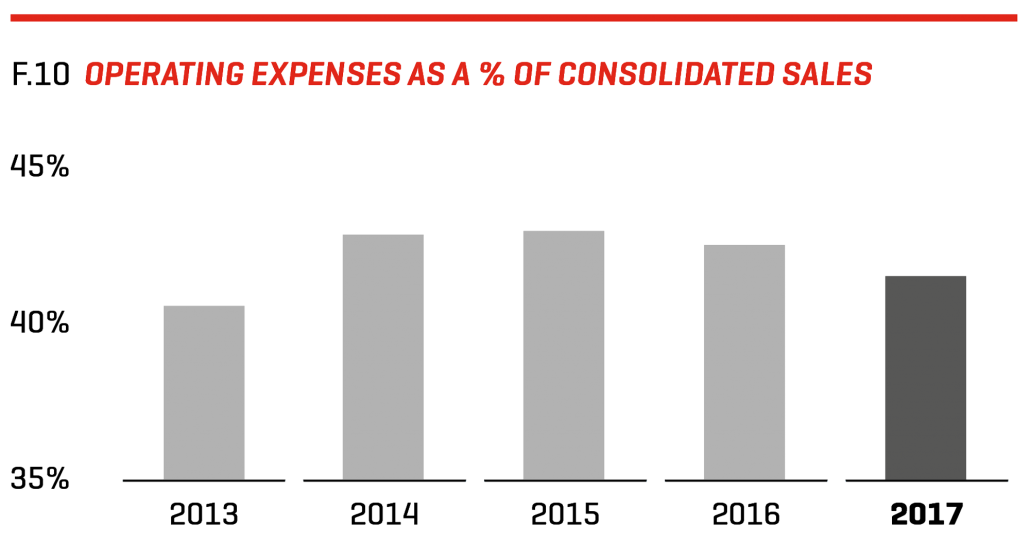
Other operating income and expenses increased in financial year 2017 by 11.7% from € 1,544.5 million to € 1,725.6 million. In percent of sales, the cost ratio improved from 42.6% to 41.7%. The decline in the cost ratio reflects the operating leverage achieved and significantly contributes to the increase in operating result.
Within the distribution expenses, there was an increase in expenses for marketing/retail by 12.4% from € 732.3 million to € 822.9 million. This development is primarily in connection with the consistent implementation of the Forever Faster brand campaign and the increased number of the Company’s own retail stores. Due to the strong sales growth, the cost ratio nevertheless reduced from 20.2% to 19.9%. Other sales and distribution expenses stood at € 497.5 million, an increase of 10.5%. The expense ratio decreased from 12.4% to 12.0%.
Expenditure for research and development/product management increased overall by 5.1% to € 98.5 million in 2017 (previous year: € 93.7 million). The cost ratio reduced slightly to 2.4% (previous year: 2.6%).
Other operating income reduced from € 0.9 million in the previous year to € 0.3 million in 2017.
The administration and general expenses increase by 14.0% from € 269.3 million to € 307.0 million. The increase resulted inter alia from higher expenses for warehouses and IT. The cost ratio of administration and general expenses was unchanged at 7.4%.
Depreciation/amortization totaling € 70.3 million (previous year: € 59.9 million) is included under the respective cost items. This represents a 17.5% increase in depreciation/amortization compared to the previous year.
OPERATING INCOME (EBIT)
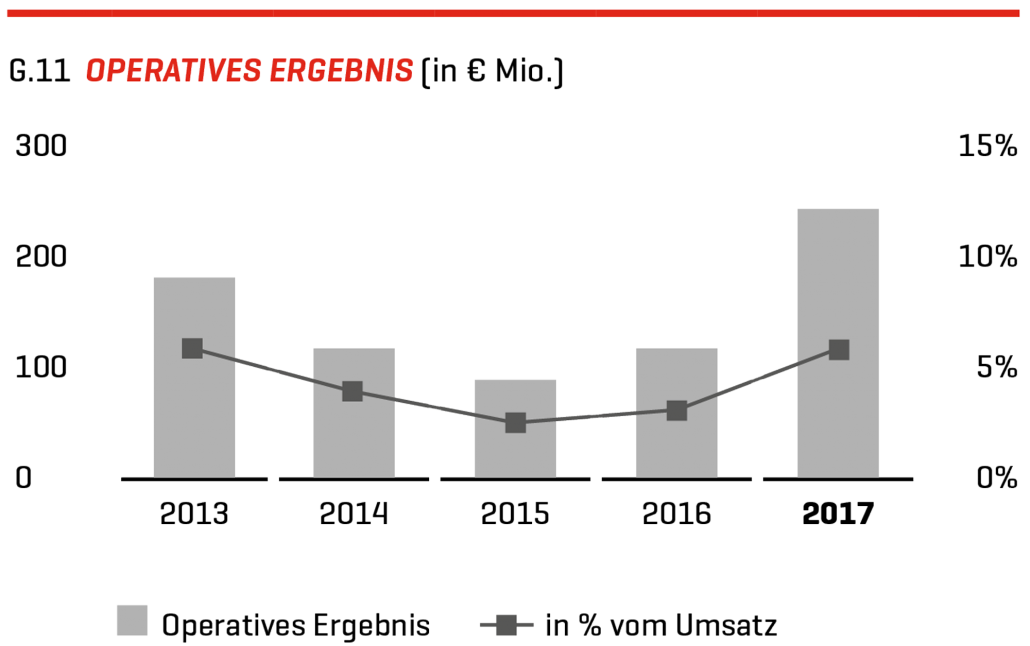
The operating result improved in 2017 by 91.7% from € 127.6 million to € 244.6 million. This result is at the upper end of the adjusted EBIT forecast (range of between € 235 million and € 245 million).
The operating margin therefore considerably improved from 3.5% in 2016 to 5.9% in the reporting year. This is mainly due to the sales growth in connection with a moderate increase in other operating income and expenses and the simultaneous improvement of the gross profit margin.
FINANCIAL RESULT
The financial result reduced in 2017 from € -8.7 million to € -13.4 million, with almost stable financial income of € 10.3 million (previous year: € 10.5 million) and almost unchanged expenses from currency conversion differences from € 6.9 million (previous year: € 6.4 million). Interest rate expenses increased in the financial year due to the increased financing expenses in connection with currency hedging contracts from € 13.4 million to € 17.8 million. The result from the associated company Wilderness Holdings Ltd., which also flows into the financial result, increased in financial year 2017 to € 1.6 million (previous year: € 1.2 million).
EARNINGS BEFORE TAXES (EBT)
In the financial year 2017, PUMA generated earnings before taxes of € 231.2 million, an improvement of 94.5% from the previous year (€ 118.9 million). Tax expenses were € 63.3 million compared to € 30.5 million in the previous year and the tax ratio increased slightly from 25.7% to 27.4% in 2017.
NET EARNINGS ATTRIBUTABLE TO NON-CONTROLLING INTERESTS
Earnings attributed to non-controlling interests are based on our joint ventures in the North American market and increased in 2017 by 23.7% to € 32.2 million (previous year: € 26.0 million). These companies concern Janed, which distributes socks and bodywear, PUMA Accessories North America and PUMA Kids Apparel that focuses on selling clothing for children.
CONSOLIDATED NET EARNINGS
Consolidated net earnings more than doubled in financial year 2017 and increased by 117.7% from € 62.4 million to € 135.8 million. Strong sales growth in connection with the moderate increase in other operating income and expenses with the simultaneous improvement of the gross profit margin were in particular crucial for the considerable improvement. In contrast, the financial result declined and there was a slight increase in the tax ratio.
Earnings per share as well as diluted earnings per share increased accordingly by 117.7% to € 9.09 in comparison to € 4.17 in the previous year.
DIVIDENDS
The Managing Directors and the Administrative Board will propose to the Annual General Meeting on Thursday, April 12, 2018 to distribute a one-off dividend of € 12.50 per share from PUMA SE’s retained earnings for financial year 2017 (previous year: regular dividend € 0.75). The dividends will be distributed in the days following the Annual General Meeting at which the resolution on the distribution is adopted.
REGIONAL DEVELOPMENT
Consolidated sales increased in 2017, currency-adjusted by 15.9%. All regions contributed to this development with double-digit growth rates.
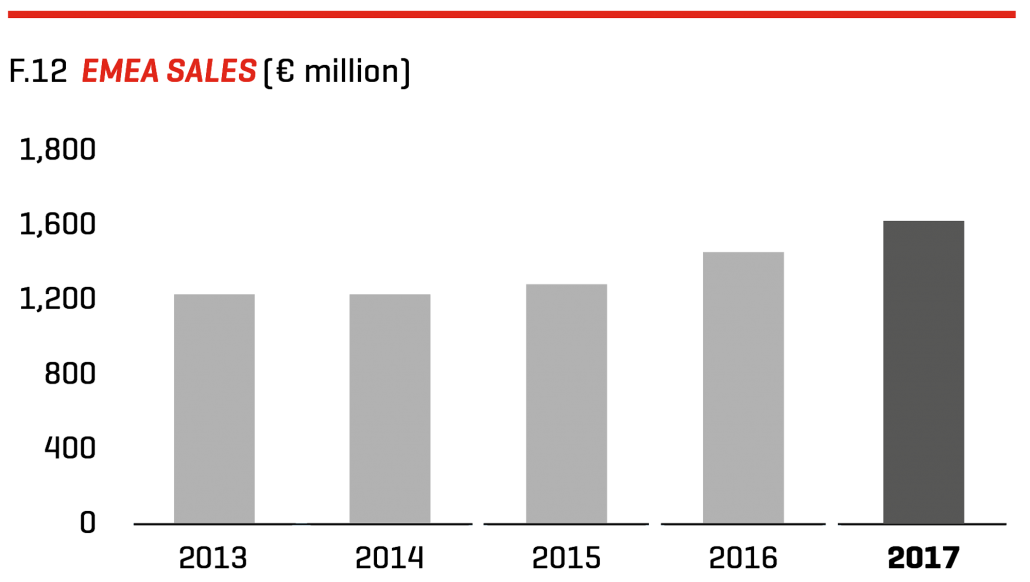
Growth momentum was particularly high in the EMEA region. Sales increased in the reporting currency, the euro, by 19.1% to € 1,646.2 million. This corresponds to a currency-adjusted increase of 19.5%. Particularly strong momentum came from France, the DACH region (Germany, Austria and Switzerland) and the UK which recorded double-digit sales growth. Moreover, Russia and South Africa also developed very positively with double-digit sales growth. The EMEA region accounted for 39.8% of consolidated sales in comparison to 38.1% in the previous year.
In the product segments, sales of footwear recorded a currency-adjusted increase by 34.8%. Sales of apparel increased, currency-adjusted by 8.2% and a sales increase of 10.4%, currency-adjusted, could be achieved in accessories.
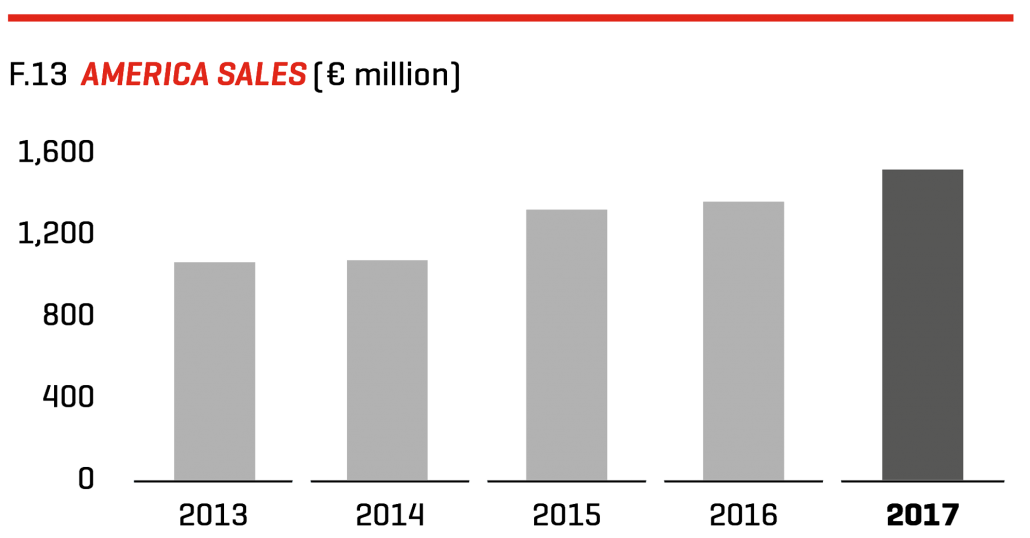
Sales in the Americas region increased in the reporting currency, the euro, by 11.6% to € 1,494.8 million. Currency-adjusted, sales increased by 14.3% where both North and Latin America contributed to the sale increase with double-digit growth rates. The share of the Americas region in Group sales reduced slightly from 36.9% in the previous year to 36.1% in 2017.
Looking at the product segments, both footwear (currency-adjusted +17.6%), apparel (+11.2%), as well as accessories (+11.0%) showed very strong double-digit growth.
In the Asia/Pacific region, sales rose in the reporting currency, the euro, by 10.0% to € 994.9 million. The currency-adjusted sales increase was 12.7%. The main driver of growth in the region was in particular China followed by Australia, which each recorded double-digit growth rates. In contrast, sales in Japan declined slightly compared to the previous year. The share of the Asia/Pacific region in Group sales reduced slightly from 24.9% in the previous year to 24.1% in 2017.
In relation to the product segments, the footwear segment was able to continue strong growth. Currency-adjusted footwear sales rose by 17.4%. Currency-adjusted apparel sales were up by 11.1%. In contrast, Accessories only recorded close to stable sales progression compared to the previous year (currency-adjusted -0.8%), which is mainly due to sales of golf clubs.
EQUITY RATIO
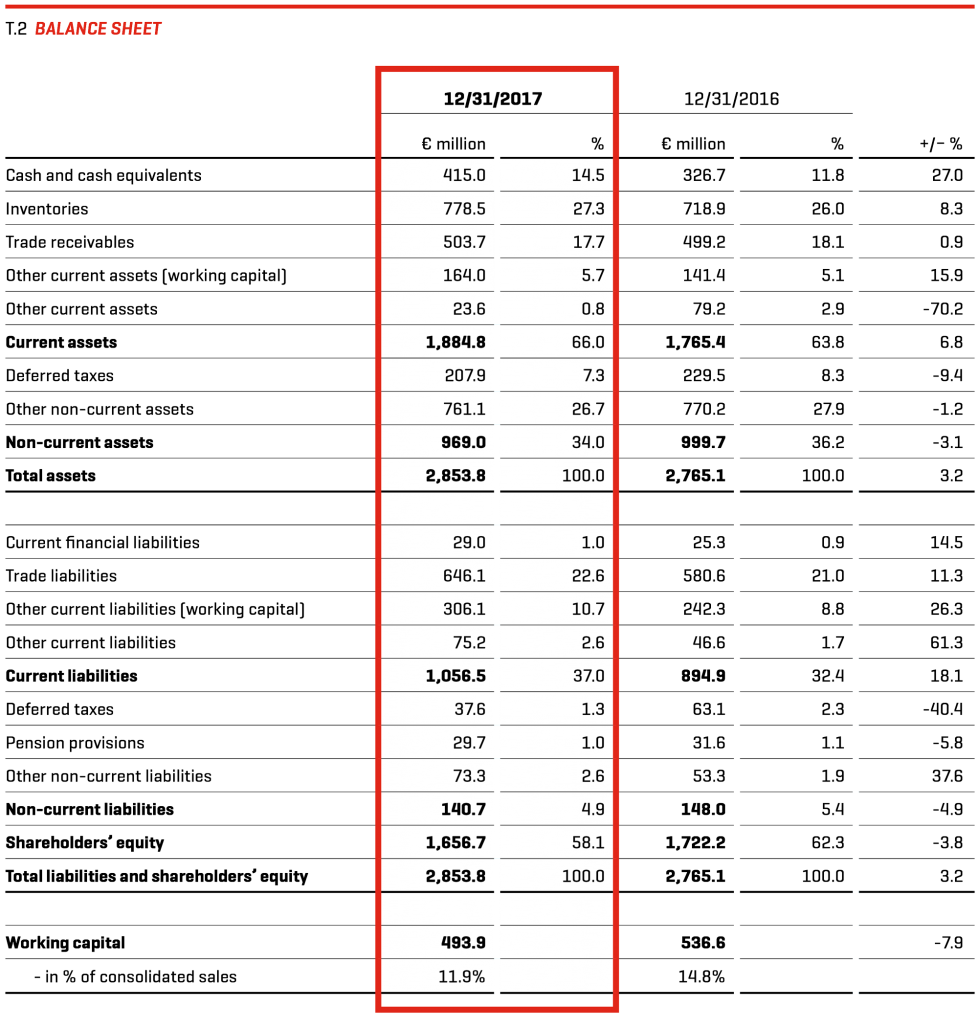
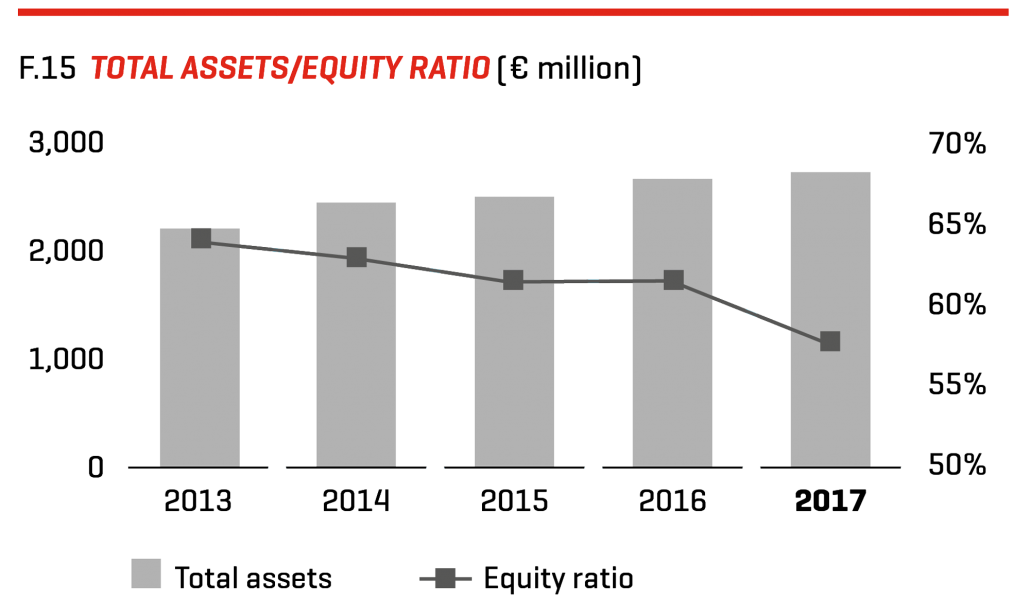
PUMA continues to have an extremely solid capital base. Total assets increased as of December 31, 2017, by 3.2% from € 2,765.1 million to € 2,853.8 million. As equity reduced by 3.8% from € 1,722.2 million to € 1,656.7 million due to negative effects from currency conversion which are directly recorded in the other comprehensive income and therefore in equity, this resulted in a reduction of the equity ratio by 4.2 percentage points from 62.3% to 58.1%.
WORKING CAPITAL
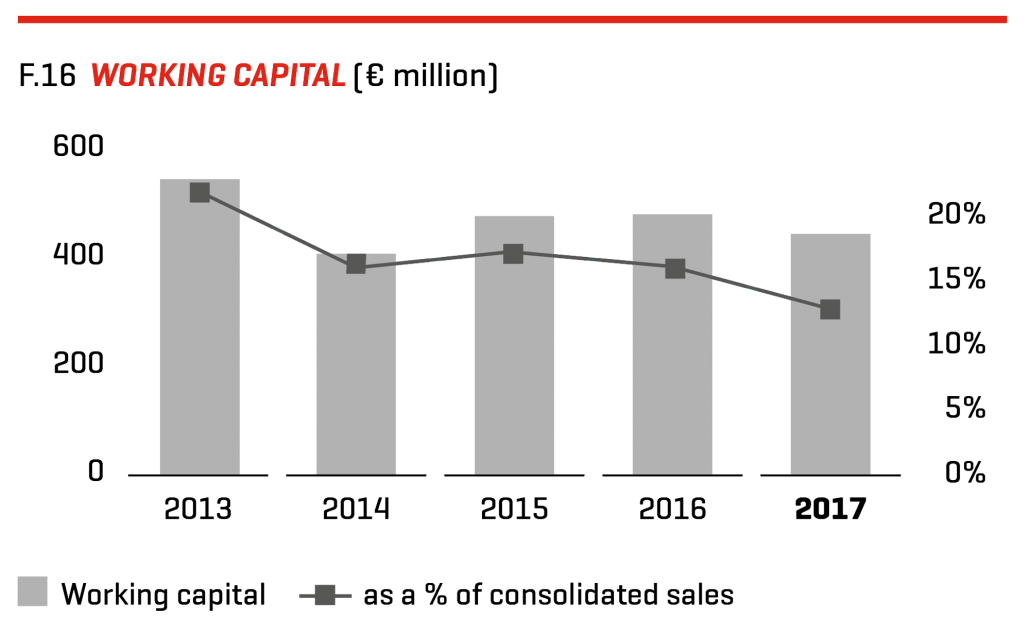
Our continued focus on working capital management and currency exchange effects led to a reduction in the working capital by 7.9% to € 493.9 million. In order to ensure the availability of products, even with increased demand and to cover the increased need for products due to new retail stores, inventories increased compared to the previous year by 8.3% from € 718.9 million to € 778.5 million. Trade receivables increased slightly by 0.9% from € 499.2 million to € 503.7 million. Trade liabilities increased by 11.3% and amounted to € 646.1 million as at December 31, 2017, compared to € 580.6 million in the previous year.
OTHER ASSETS AND OTHER LIABILITIES
Other current assets, which include the positive market value of derivative financial instruments, decreased compared to the previous year by 70.2% to € 23.6 million.
Other non-current assets, consisting mainly of intangible assets and property, plant and equipment, remained broadly stable at € 761.1 million.
Other current liabilities, which include the negative market value of derivative financial instruments, increased compared to the previous year from € 46.6 million to € 75.2 million.
Pension provisions reduced slightly in 2017 by 5.8% to € 29.7 million.
Other non-current liabilities increased compared to the previous year by 37.6% to € 73.3 million. The increase is connected with the long-term loan to expand the building at the Herzogenaurach location.
CASH FLOW
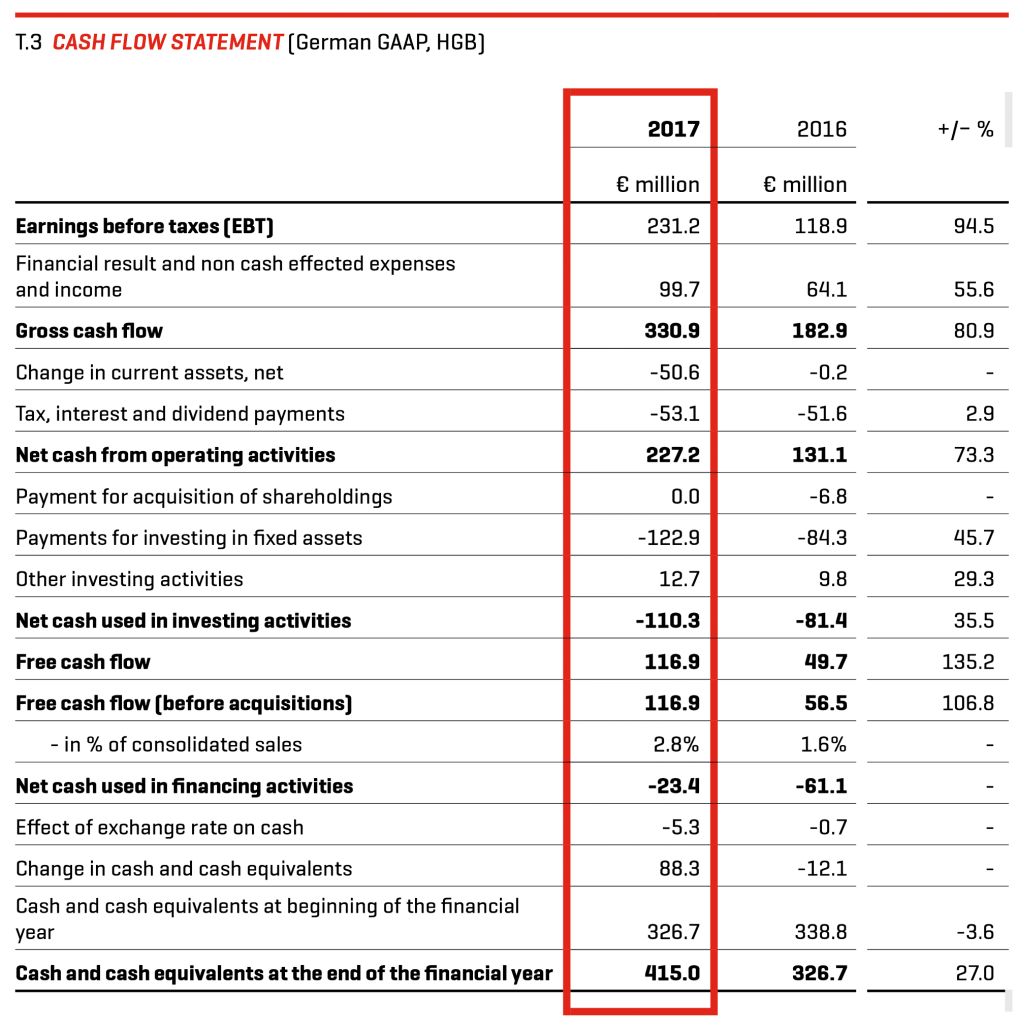
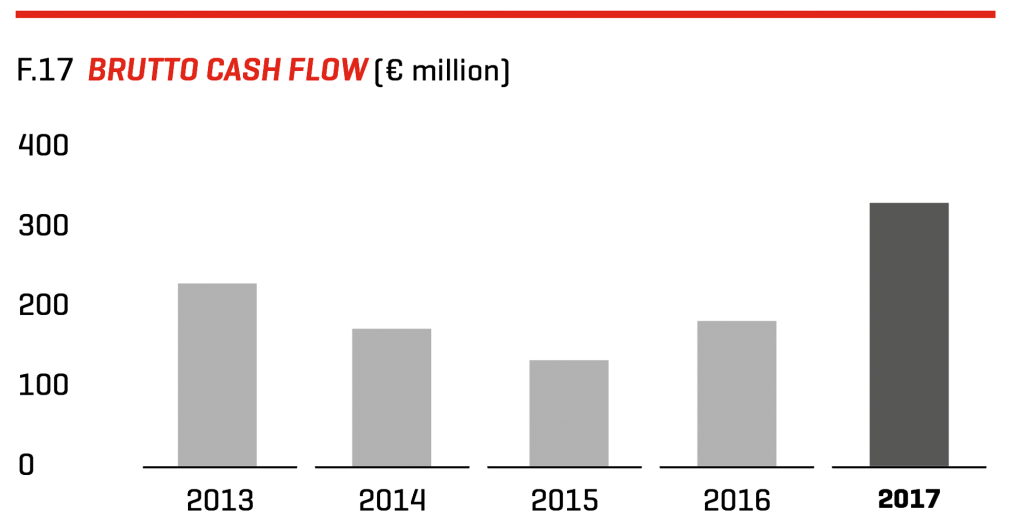
Gross cash flow improved in financial year 2017 due to the higher pre-tax profit by 80.9% from € 182.9 million to € 330.9 million. The financial result and non-cash effected expenses and income, which in particular include depreciation and amortization of property, plant and equipment, amounted to € 99.7 million in 2017.
The focus on working capital management significantly contributed to the improvement of cash flow from operating business activity. In financial year 2017, net cash from operating activities increased from € 131.1 million in the previous year to € 227.2 million. The considerable improvement is due to the higher pre-tax profit as well as due to the decline of net working capital* in 2017. By contrast, the cash outflow from tax, interest and dividend Payments increased by 2.9% to € 53.1 million.
The cash outflow from investing activities increased in the reporting year by 35.5% from € 81.4 million to € 110.3 million. Investment in fixed assets mainly involved investment in the company’s own retail stores, IT infrastructure and the expansion of the building in Herzogenaurach in financial year 2017. Investments increased from € 84.3 million in the previous year to € 122.9 million. Other investing activities are associated with incoming payments from disposals of assets.
* Net working capital includes normal working capital line items plus current assets and liabilities, which are not normally part of the working capital calculation.
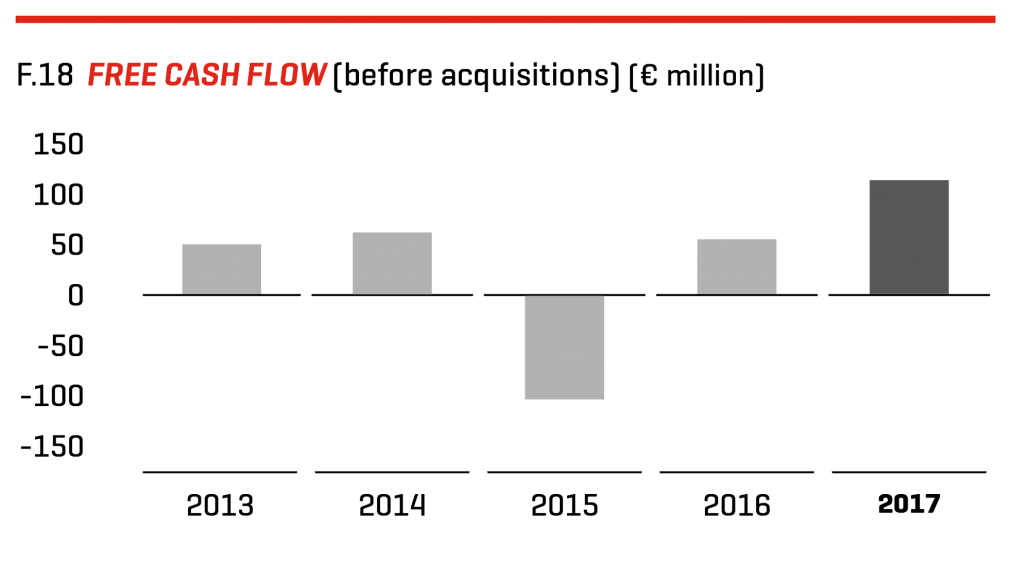
The free cash flow before acquisitions is the balance of the cash inflows and outflows from current operating and investing activities. Furthermore, an adjustment for payments in association with acquisitions is made. As a result of the higher pre-tax profit and the improvement of the cash flow from working capital, free cash flow before acquisitions improved by 106.8% from € 56.5 million to € 116.9 million. In percent of consolidated sales, free cash flow before acquisitions amounted to 2.8% compared to 1.6% in the previous year.
Cash flow from financing activities for financial year 2017 mainly resulted from dividend payments to PUMA SE shareholders of € 11.2 million and dividend payments to non-controlling interests of € 13.4 million. Net cash used in financing activities totaled € 23.4 million (previous year: cash outflow of € 61.1 million).
As of December 31, 2017, PUMA had cash and cash equivalents of € 415.0 million, an increase in cash and cash equivalents of 27.0% compared to the previous year (€ 326.7 million). The PUMA Group also had credit facilities totaling € 497.1 million as of December 31, 2017 (previous year: € 487.6 million). Unutilized credit lines totaled € 440.2 million on the reporting date, compared to € 433.1 million in the previous year.
MANAGING DIRECTOR’S STATEMENT REGARDING THE BUSINESS DEVELOPMENT AND THE OVERALL SITUATION OF THE PUMA GROUP
We are extremely satisfied with the course of business and economic development in the last financial year. In 2017 sales and profitability have developed significantly better than originally expected. As a result, our forecast for financial year 2017 saw an upwards increase several times throughout the year. At the end of 2017, the increased financial targets were fully achieved and were even slightly exceeded with regard to the development of the gross profit margin. This success gives us confirmation that we are on the right path with the consistent implementation of the Forever Faster company strategy.
The strong sales growth in 2017 (currency-adjusted +15.9%) led to PUMA being able to exceed the symbolic sales mark of four billion euros for the first time in the Company’s history. This meant that the sale of our products in our own retail stores and to our wholesale customers continued to improve. In our opinion, this is attributable above all to the increase in our brand heat and the improvement of our product range. With a view to profitability in 2017, we also improved significantly and achieved a considerable improvement in the operating result (EBIT), consolidated net earnings and the earnings per share. The operating result increased in the past financial year due to increased sales and thanks to the improved gross profit margin, as well as the improved operating leverage, by 91.7% from € 127.6 million to € 244.6 million. Consolidated net earnings and earnings per share more than doubled in 2017.
With regard to the consolidated balance sheet, we believe that PUMA has continued to have an extremely solid capital base (equity of approximately € 1.7 billion, equity ratio 58.1%). Furthermore, the ongoing focus on working capital management contributed to the fact that working capital reduced by 7.9% compared to the previous year despite the significant increase in sales.
The improvement of the income situation and focus on working capital also led to a considerable improvement in cash flow in the past financial year. Free cash flow before acquisitions more than doubled from € 56.5 million in the previous year to € 116.9 million. Cash and cash equivalents amount to € 415.0 million on the reporting date.
As a result, the PUMA group is characterized by an overall solid asset, financial and income situation at the time the Group management report was prepared. This enables us and the Administrative Board to propose a one-off dividend of € 12.50 per share for financial year 2017 (previous year: regular dividend € 0.75 per share) to the Annual General Meeting on Thursday, April 12, 2018.

