Net income attributable to non-controlling interests
-60.7
-0.7%
-55.7
-0.6%
9.0%
Net income
281.6
3.2%
304.9
3.5%
-7.6%
Weighted average number of outstanding shares (million shares)
149.32
149.85
-0.4%
Weighted average number of outstanding shares, diluted (million shares)
149.38
149.87
-0.3%
Earnings per share (€)
1.89
2.03
-7.3%
Earnings per share (€) - diluted
1.89
2.03
-7.3%
Illustration of earnings development in 2024 compared to the outlook
In the outlook in the combined management report for 2023, PUMA forecast an operating result (EBIT) in the range between € 620 million and € 700 million for financial year 2024 (2023: € 621.6 million). At the end of the second quarter, the outlook was narrowed down within the original range, and an operating result (EBIT) of between €620 million and €670 million was expected. However, the volatile environment, with persistent currency headwinds, a promotional market and globally muted consumer sentiment, had a negative impact on profitability. Nevertheless, PUMA was able to reach the lower end of the outlook for the operating result for 2024 as a whole.
More details on earnings development in the financial year under review are provided below.
Gross profit margin
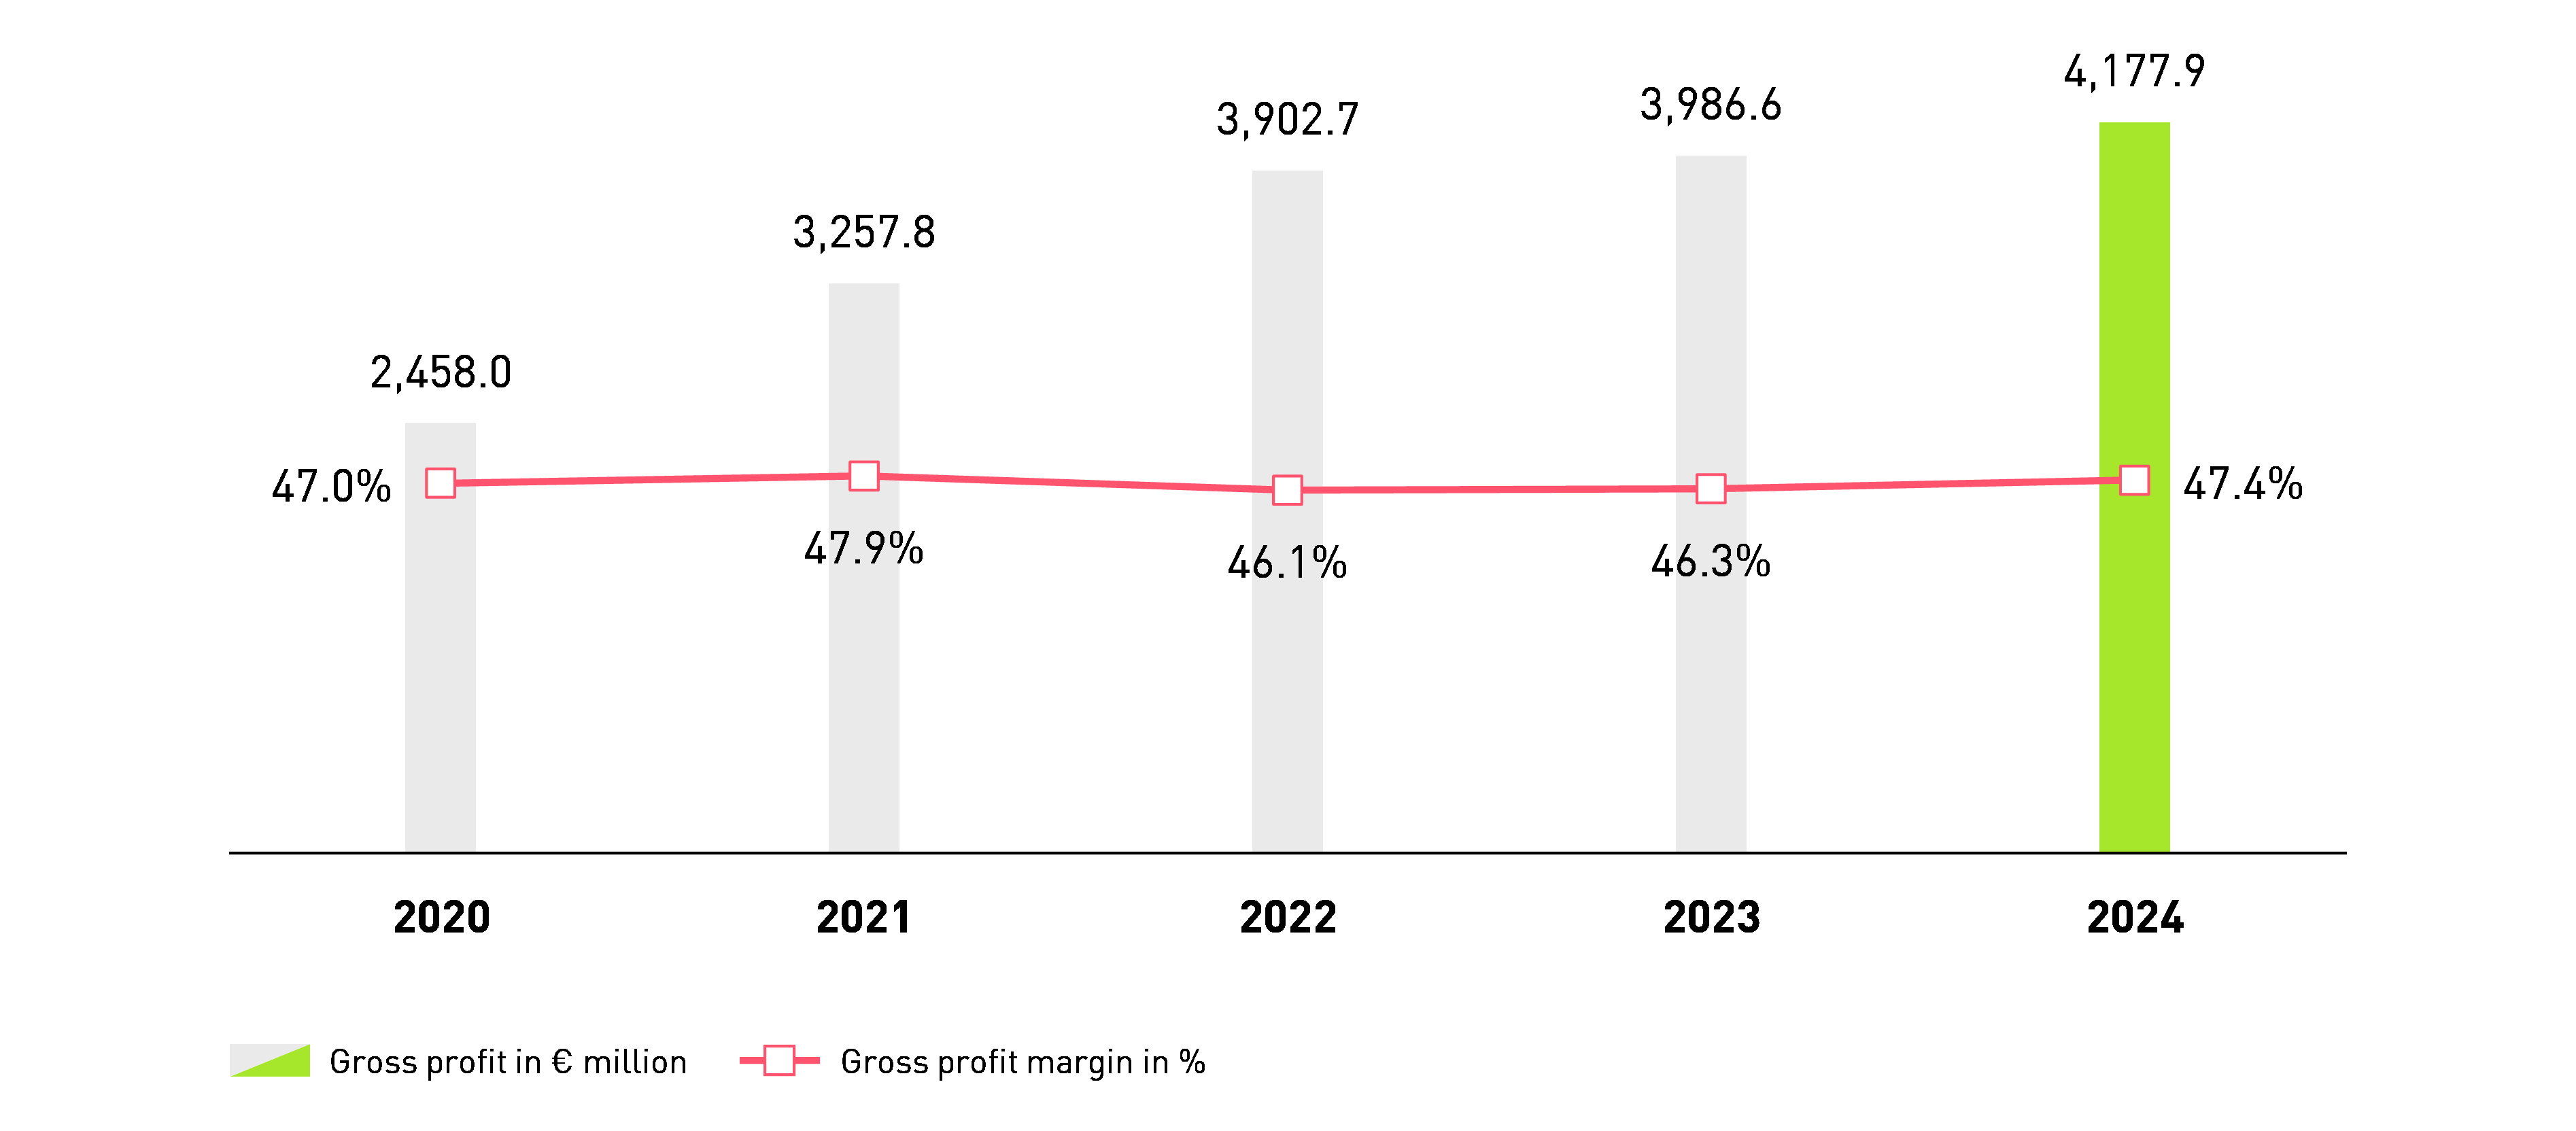
PUMA's gross profit in financial year 2024 increased by 4.8% from € 3,986.6 million to € 4,177.9 million. The gross profit margin improved by a rounded 100 basis points from 46.3% to 47.4%. Headwinds from currencies and discounts were more than offset by a favourable product and distribution channel mix. The negative currency effects on the gross profit margin, including the effects of currency hedging, resulted primarily from the US dollar due to its strength against the euro and other currencies during 2024. In addition, the negative currency effects relate to a lesser extent to the Japanese yen, the Mexican peso and the Turkish lira.
The gross profit margin in the Footwear product division increased from 45.4% in the previous year to 46.9% in 2024. The gross profit margin for Apparel increased from 47.8% to 48.1%. The gross profit margin for Accessories also improved, rising from 46.6% to 47.6% in 2024.
G.07GROSS PROFIT/GROSS PROFIT MARGIN
Licensing business
PUMA grants licences to independent partners for various product divisions, such as glasses, safety shoes, workwear and gaming accessories. In addition to design, development and manufacture, these companies are also responsible for product distribution. Income from licence agreements also includes some distribution licences for different markets. PUMA's royalty and commission income decreased by 37.1% to € 24.3 million in financial year 2024 (previous year: € 38.5 million). The main reason for this decline was a decrease in royalties from the Formula 1 business, as this business was taken over by our subsidiary, stichd.
Other operating income and expenses
The net expense of other operating income and expenses (OPEX) increased by 5.2% in financial year 2024 to € 3,580.2 million (previous year: € 3,403.5 million). This increase is largely due to the continued growth of our DTC business and further investments into our warehouse and digital infrastructure. The cost ratio increased from 39.6% in the previous year to 40.6% in 2024.
G.08OPERATING EXPENSES (as a % of sales)
Within sales expenses, marketing/retail expenses increased by 5.7% to € 1,736.9 million, while the cost ratio was 19.7% of sales in 2024, compared with a cost ratio of 19.1% in the previous year. Other sales expenses, which mainly include sales-related costs and costs for warehousing and logistics, increased by 1.6% to € 1,174.7 million. The cost ratio of other sales expenses decreased to 13.3% of sales in 2024 compared to a cost ratio of 13.4% in the previous year.
Research and development/product management expenses increased by 5.7% compared to the previous year, reaching € 181.3 million, and the cost ratio increased to 2.1% of sales. Research and product development at PUMA mainly comprise the areas of innovation (new technologies), product design and model and collection development. The research and product development activities range from the analysis of scientific studies and customer surveys through the generation of creative ideas to the implementation of innovations in commercial products. The activities in research and product development are directly linked to sourcing activities. As of 31 December 2024, a total of 1,438 people were employed in research and development/product management (previous year: 1,406). In 2024, research and development/product management expenses totalled € 181.3 million (previous year: € 171.5 million), of which € 92.0 million (previous year: € 89.0 million) related to research and development alone.
Other operating income in the past financial year amounted to € 8.3 million and includes rental income, capital gains from finance leases and income from the sale of fixed assets. General and administrative expenses increased by 9.9% to € 495.6 million in 2024. The cost ratio of general and administrative expenses increased to 5.6% of sales in 2024. Depreciation and amortisation are included in the relevant costs and total € 370.2 million (previous year: € 351.7 million). The increase in depreciation compared to the previous year is due to investments in IT systems, warehouses and own retail stores. In addition, the respective costs include impairment losses totalling € 7.9 million and reversals of impairment losses in the amount of € 29.4 million, which are related to the valuation of the rights of use of retail stores.
Result before interest, taxes, depreciation and amortisation (EBITDA)
The result before interest (= financial result), taxes, depreciation and amortisation (including impairment losses and reversals of impairment losses) (EBITDA) increased by 0.4% to € 970.7 million in financial year 2024 (previous year: € 967.1 million). The EBITDA margin, however, decreased from 11.2% in the previous year to 11.0% in 2024.
Operating result (EBIT)
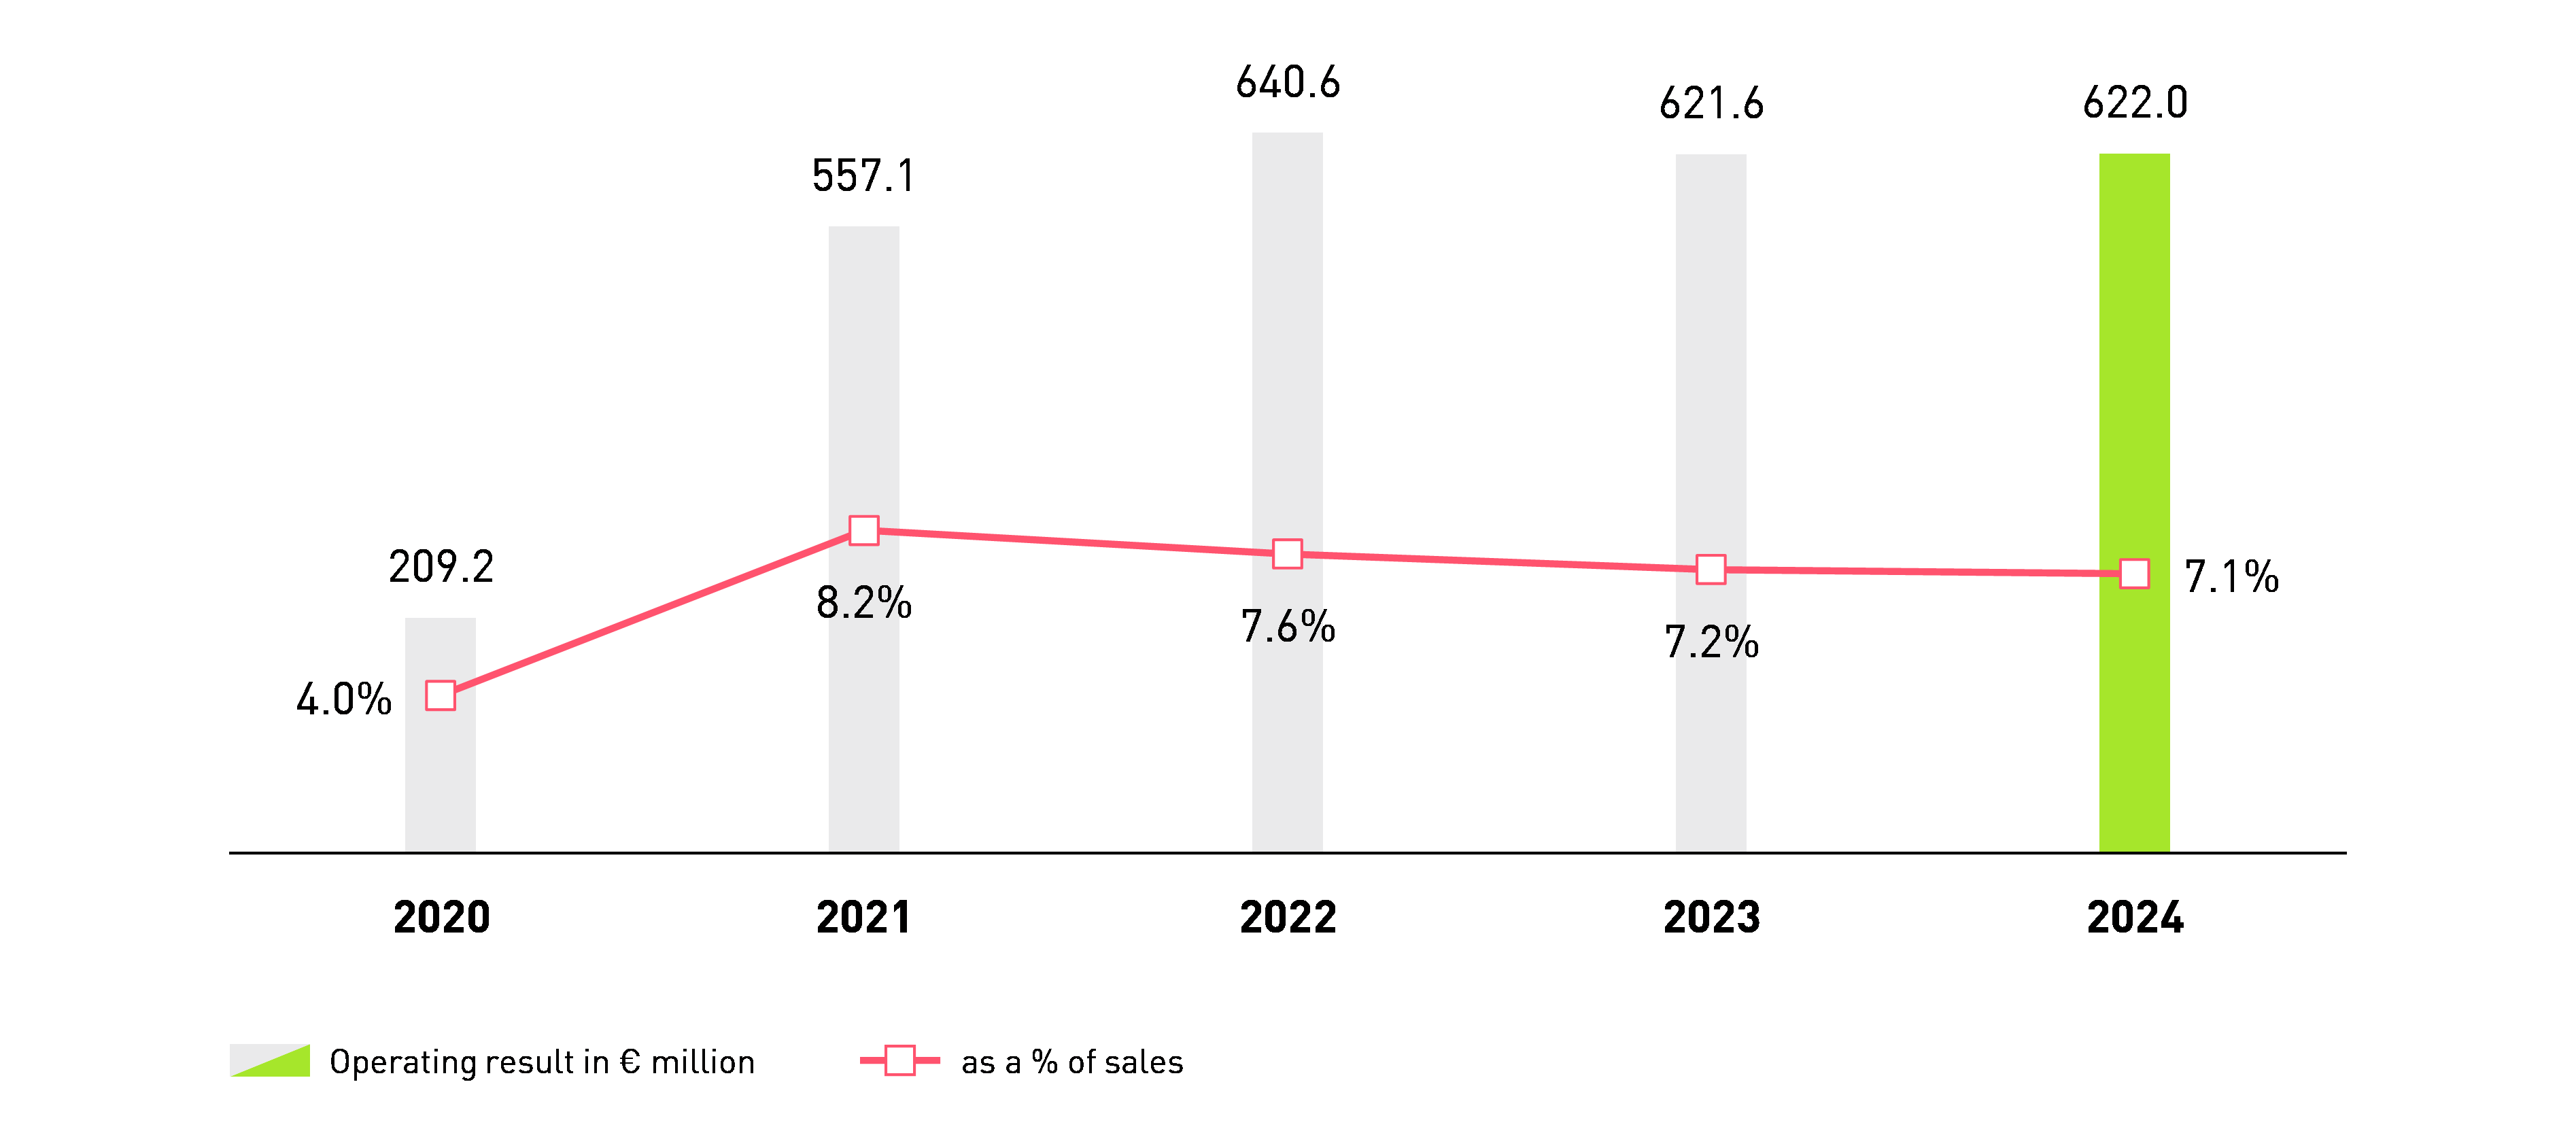
In financial year 2024, the operating result increased by 0.1% from € 621.6 million in the previous year to € 622.0 million. The increase in sales and the improvement in the gross profit margin was almost completely offset by the increase in other operating income and expenses. The EBIT margin decreased from 7.2% in the previous year to 7.1% in 2024.
G.09OPERATING RESULT
Financial result
The financial result decreased in 2024 from a net amount of € -143.3 million in the previous year to € -159.7 million. This development is mainly due to the increase in interest expenses in 2024 to a total of€ -128.4 million (previous year: € -100.8 million). The decline in interest income in 2024 to a total of € 31.4 million compared to € 37.8 million in the previous year also contributed to this development. In addition, losses from currency translation differences increased to a total of € -88.5 million in 2024 compared to€ -69.4 million in the previous year. In contrast, there were positive effects in 2024 from the improvement in other financial income and expenses, which include in particular forward or time components in connection with currency derivatives, from € 12.8 million in the previous year to € 51.7 million in 2024, and expenses from hyperinflation effects decreased to € -17.4 million (previous year: € -23.7 million). By contrast, the devaluation of investment property totalling € 8.8 million (previous year: € 0.0 million) as a result of hyperinflation accounting.
Earnings before taxes (EBT)
In financial year 2024, PUMA generated earnings before taxes of € 462.3 million. This corresponds to a decrease of 3.3% compared to the previous year (€ 478.3 million). Tax expenses increased to € 120.0 million, compared to € 117.8 million in the previous year. The group tax rate increased from 24.6% to 25.9%, mainly due to a change in the composition of the consolidated net income, increased expenses from withholding taxes and the effects of the introduction of the global minimum tax.
Net earnings attributable to non-controlling interests
Net earnings attributable to non-controlling interests relate to companies in the North American market, in each of which the same shareholder holds a minority stake. The earnings attributable to these interests increased by 9.0% to € 60.7 million in the 2024 financial year (previous year: € 55.7 million). The companies affected are PUMA United North America LLC, PUMA United Aviation North America LLC, PUMA United Canada ULC and Janed Canada LLC. The business purpose of these companies is mainly the sale of socks, bodywear, accessories and children's apparel in the North American market.
Consolidated net income
In financial year 2024, consolidated net income decreased by 7.6% from € 304.9 million to € 281.6 million. Despite operating result (EBIT) at the previous year's level, the decline in the financial result, the slightly higher tax expense due to a higher tax rate and the increase in the result attributable to non-controlling interests led to this development.
Earnings per share and diluted earnings per share decreased from € 2.03 in the previous year to € 1.89 in financial year 2024, in line with the development of the consolidated net income.
This site uses tracking technologies from various providers
This site uses third party website tracking technologies to provide and continuously improve its services and display advertisements according to users' interests. Our cookie banner allows users to choose between three options. Until he confirms the banner, the scripts for statistics and marketing cookies will not be executed. I agree and can withdraw or change my consent at any time with effect for the future.
Functional – Basic website functions require this cookie, it is needed and cannot be deselected.
Statistics – Tracking services for the collection of user statistics.
Marketing – Cookies from third-party services that collect data on the website and merge it with your own data.