The basis of our environmental efforts is to ensure that PUMA and its suppliers are in full environmental compliance and any impact on the environment is optimized.
We conducted 19 energy efficiency audits last year at our own entities, following up on a first audit cycle in 2015. These audits, which are compulsory in the European Union, help us identify energy saving opportunities at our offices, stores and warehouses, which we can then roll out on a global basis.
As far as our suppliers are concerned, our PUMA compliance audits (as described in the Social Compliance section of this report) contain a dedicated section on environmental and chemical compliance. During each audit, we check, for example, environmental permits, waste management and effluent treatment plants.
In addition, we continued to ask all of our core suppliers to complete the Environmental Facilities Module of the Sustainable Apparel Coalition. 127 of those assessments were externally verified in 2019, which equates to an onsite environmental audit. This figure is complemented by audits which our suppliers undergo frequently to obtain environmental certifications such as from bluesign®, OEKO-TEX, GOTS, GRS or the Leather Working Group.
Target Description:
Science based CO2 reduction target to be developed (2016) and implemented (2020).
Relates to United Nations Sustainable Development Goal 13
Interim Target:
Relative reduction of Scope 1,2 and 3 CO2 emissions by 3% per year
Examples for the 10FOR20 Action Plan:
KPIs:
During the UN Climate Conference in Paris 2015, PUMA agreed to set a science-based CO2 emissions target. After two attempts in 2017 and 2018, and the formation of the Fashion Industry Charter on Climate Action in 2018, we finally agreed our science based CO2 emissions target with the Science Based Target Coalition in 2019 and published the target in June.
The year 2019 also saw the formation of 7 working groups as part of the Fashion Charter on Climate Action. PUMA is active in 5 of those working group and chairs the Steering Committee of the Charter. PUMA also co-chairs the working group on Sector Decarbonization.

On a global stage, PUMA has played an instrumental role in creating the UN-convened Fashion Industry Charter for Climate Action and in mobilizing its suppliers, peers and partners in the industry and beyond to join his industry-wide collaboration platform on climate. As a founding signatory, PUMA continues to play a key role by chairing the Steering Committee of the Fashion Charter and is actively engaged in supporting working groups focused on decarbonization, manufacturing/energy and financial tools. We look forward to working with PUMA going forward as it aligns its climate targets with science (1.5 degree temperature goal) and together with other signatories of the charter continue to push for more ambitious, rapid, robust and credible processes to get there.
Lindita Xhaveri-Salihu
Sectors Engagement Lead UN Climate Change, Global Climate Action
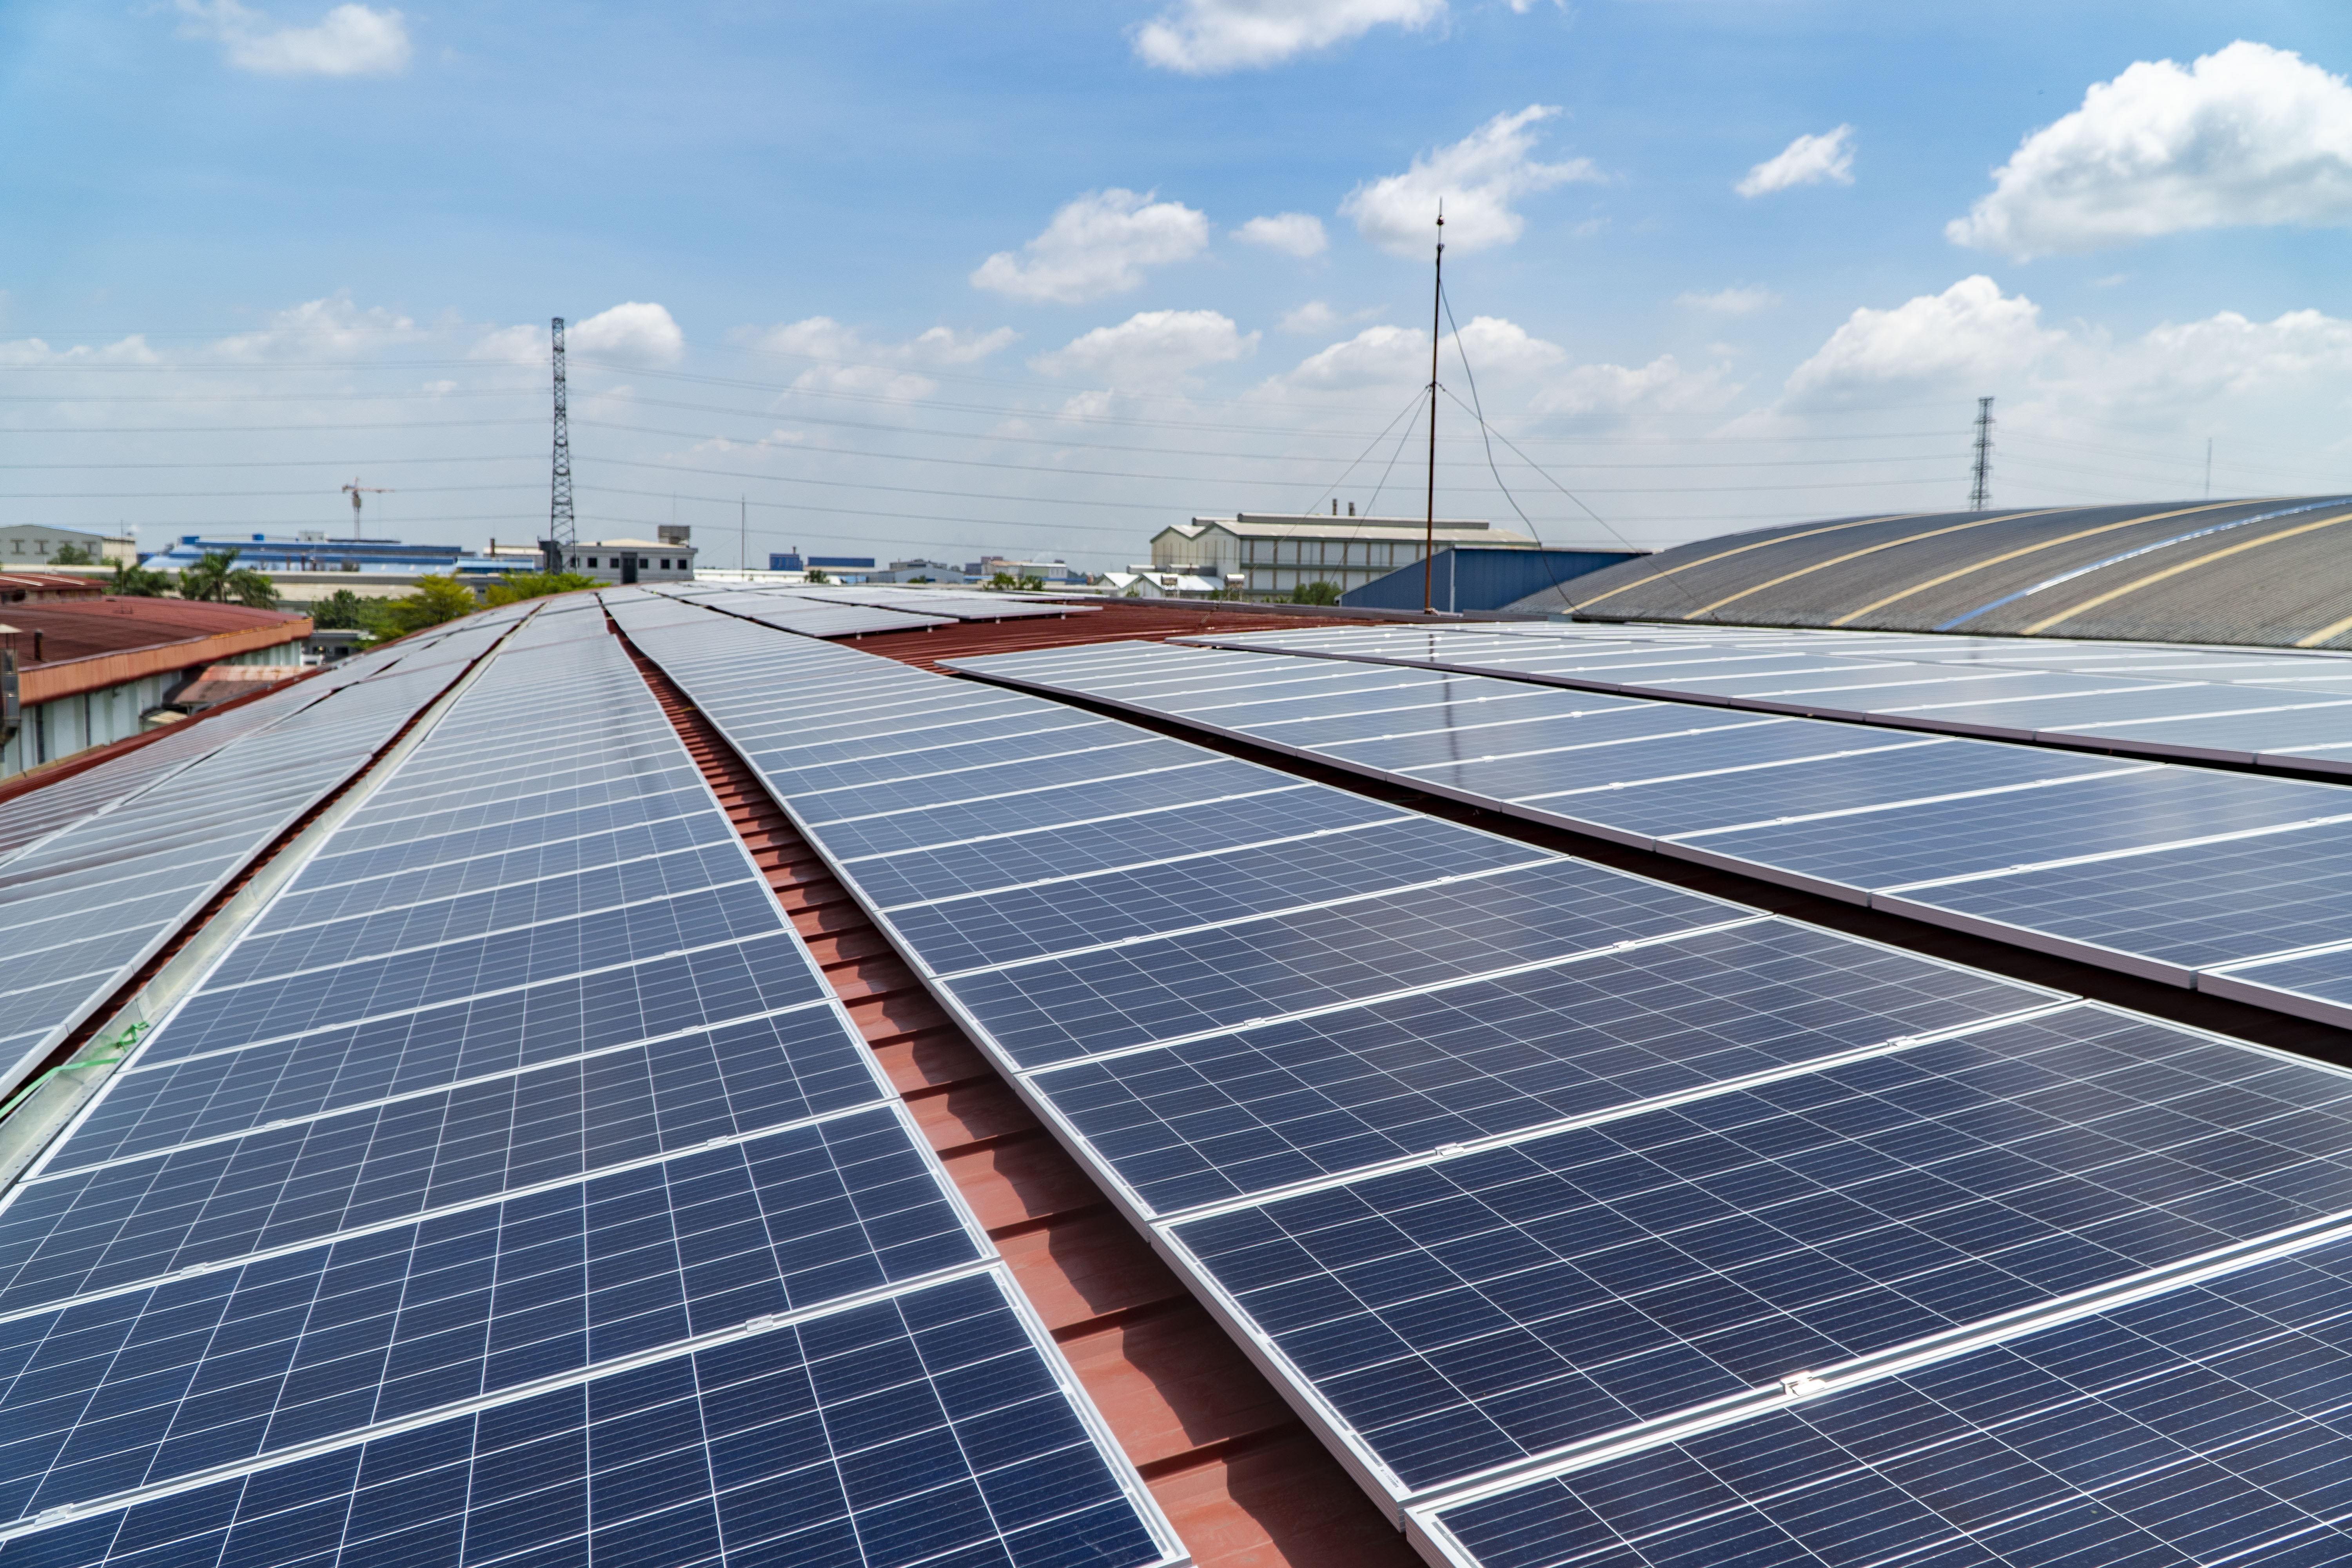
We combined our Science Based Target (SBT) agreement with an increased effort to support the use of renewable electricity by purchasing Renewable Energy Attribute Certificates (RECs) for those countries where PUMA has a major presence and renewable electricity cannot be purchased directly. We purchased RECs worth 50% of PUMA’s emissions from electricity for 2018 retrospectively and increased that figure to 75% in 2019.
In this way, we managed to lower our combined Scope 1 and 2 Emissions by 38% compared to 2018 and 63% compared to 2017. Taking these RECs into account, we hit our Science Based Emissions Target of 35% reduction for Scope 1 and 2 Emissions in 2019, one year ahead of schedule.
* Science Based reduction Target (SBT)
** Renewable Energy Attribute Certificates
In an attempt to balance our increasing Scope 3 emissions, we expanded the reach of our energy efficiency programs to China and Taiwan by joining the Clean by Design Program of the Apparel Impact Institute (https://apparelimpact.org/).
As part of our commitment to All, four of our fabric producers with wet-processing units have been entered into the Clean by Design program in a first phase (two more will be engaged in the first batch 2020), and we reserved the right to expand coverage further, should the program prove successful.
Another effort to reduce our Tier 1 carbon footprint further was made by joining WWF’s Low Carbon Manufacturing Program. We recruited our largest garment factory to participate in the starter phase, identifying energy saving opportunities and providing online carbon accounting training.
Our program in Vietnam, which is run in partnership with IFC, has shown positive results, with 5500 tons of CO2 saved from energy efficiency measures. Our vendors also committed to install 2 megawatt hours of solar panels to create electricity.
The reduction of our Scope 3 emissions at factory level is complemented by purchasing more sustainable – and therefore also less carbon-intensive – raw materials. For example, after hitting our 50% bluesign® certified polyester target in 2018 already, we set new, more ambitious targets. In 2019 we achieved use of over 90% bluesign® or OEKO-TEX certified polyester and by 2025, we aim for 75% recycled polyester usage.
| CO2e-Emissions 1 - 8 (absolute figues) |
2019 | 2018 | 2017 | 2016 | 2015 | % Change 2019/18 |
% Change 2019/2015 |
|---|---|---|---|---|---|---|---|
| Scope 1 – Direct CO2e-Emissions Fossile Fuels (T) | 6,326 | 6,918 | 7,678 | 6,854 | 7,296 | -8.6 | -13.3 |
| Car Fleet | 3,618 | 4,073 | 4,134 | 3,746 | 4,087 | -11.2 | -11.5 |
| Heating | 2,708 | 2,845 | 3,545 | 3,107 | 3,209 | -4.8 | -15.6 |
| Scope 2 - Indirect CO2e Emissions Electricity & Steam [T] | 40,986 | 43,366 | 40,029 | 37,300 | 35,591 | -5.5 | 15.2 |
| Scope 2 - Indirect CO2e Emissions Electricity & Steam [T] incl. RECs | 11,533 | 22,128 | 40,029 | 37,300 | 35,591 | -47.9 | -67.6 |
| Electricity (excl. RECs) | 39,282 | 42,145 | 38,914 | 36,046 | 34,445 | -6.8 | 14.0 |
| Electricity (incl. RECs) | 9,828 | 20,907 | 38,914 | 36,046 | 34,445 | -53.0 | -71.5 |
| Steam | 1,705 | 1,221 | 1,115 | 1,254 | 1,146 | 39.6 | 48.8 |
| Subtotal Scope 1-2 | 47,312 | 50,284 | 47,707 | 44,153 | 42,887 | -5.9 | 10.3 |
| Subtotal Scope 1-2 incl. RECs | 17,858 | 29,046 | 47,707 | 44,153 | 42,887 | -38.5 | -58.4 |
| SCOPE 1-2 CO2e EMISSIONS RELATIVE TO SALES (in tons CO2e per € million sales per year) | 8.6 | 10.8 | 11.5 | 12.2 | 12.7 | -20.5 | -32.1 |
| SCOPE 1-2 CO2e EMISSIONS RELATIVE TO SALES (in tons CO2e per € million sales per year) (incl. RECs) | 3.2 | 6.2 | 11.5 | 12.2 | 12.7 | -48.1 | -74.4 |
| CO2e-Emissions 1 - 8 (absolute figures) |
2019 | 2018 | 2017 | 2016 | 2015 | % Change 2019/18 |
% Change 2019/2015 |
|---|---|---|---|---|---|---|---|
| Scope 3 - Other indirect emissions [T] | 272,540 | 222,315 | 208,525 | 196,896 | 192,305 | 22.6 | 41.7 |
| Scope 3 - Other indirect emissions [T] incl. RECs | 250,240 | 222,315 | 208,525 | 196,896 | 192,305 | 12.6 | 30.1 |
| CO2e Emissions from business travel transportation [T] | 18,727 | 15,582 | 14,394 | 12,167 | 10,191 | 20.2 | 83.8 |
| CO2e Emissions from B2B transport of goods [T] | 98,386 | 74,182 | 64,076 | 48,484 | 57,085 | 32.6 | 72.3 |
| CO2e Emissions from B2C transport of goods [T] | 9,358 | 5,961 | 6,994 | 16,223 | 6,321 | 57.0 | 48.0 |
| CO2e Emissions from Suppliers | |||||||
| CO2e Emissions from production in Tier 1 supply chain [T] | 146,069 | 126,590 | 123,061 | 120,023 | 118,708 | 15.4 | 23.0 |
| CO2e Emissions from production in Tier 1 supply chain [T] incl. RECs | 123,769 | 126,590 | 123,061 | 120,023 | 118,708 | -2.2 | 4.3 |
| SCOPE 3 CO2e EMISSIONS RELATIVE TO SALES (in tons CO2e per € million sales per year) | 49.5 | 47.8 | 50.4 | 54.3 | 56.8 | 3.6 | -12.7 |
| SCOPE 3 CO2e EMISSIONS RELATIVE TO SALES (in tons CO2e per € million sales per year) (incl. RECs) | 45.5 | 47.8 | 50.4 | 54.3 | 56.8 | -4.9 | -19.9 |
| Total Scope 1-3 [T] | 319,852 | 272,599 | 256,232 | 241,049 | 235,192 | 17.3 | 36.0 |
| Total Scope 1-3 [T] incl. RECs | 268,098 | 251,361 | 256,232 | 241,049 | 235,192 | 6.7 | 14.0 |
| Annual Sales PUMA (in € million) | 5,502 | 4,648 | 4,136 | 3,627 | 3,387 | 18.4 | 62.4 |
| TOTAL CO2e EMISSIONS RELATIVE TO SALES (in tons CO2e per € million sales per year) | 58.1 | 58.6 | 62.0 | 66.5 | 69.4 | -0.9 | -16.3 |
| TOTAL CO2e EMISSIONS RELATIVE TO SALES (in tons CO2e per € million sales per year) (incl. RECs) | 48.7 | 54.1 | 62.0 | 66.5 | 69.4 | -9.9 | -29.8 |
|
|||||||
Target Description and Examples of the 10FOR20 Action Plan:
Zero Discharge of Hazardous Chemicals from our Supply Chain by 2020.
Relates to Sustainable United Nations Development Goals 3,6
KPIs:
While the effects of potentially hazardous chemicals on human health have yet to be completely assessed, PUMA takes precautionary measures to prevent potential harm to human health and the environment from its products and operations.
All materials used in PUMA products are subject to our Restricted Substance List (RSL) testing program to ensure compliance with global chemicals regulations.
For testing purposes, we rely on the Product RSL developed by the AFIRM Group as well as the Manufacturing RSL developed by ZDHC rather than own PUMA testing standards.
Since 2015, we have increased the amount of RSL tests by 183% to 6605 while the failure rate decreased from 7.7% to 1.1%. When materials fail an RSL test, they cannot be used for PUMA products until the failure is corrected and they successfully pass the test. In this way we mitigated the risk of product level RLS failures, of which there were none in 2019.
| Product Division | 2019 | 2018 | 2017 | 2016 | 2015 | Variation 2018/2019 (%) |
Variation 2015/2019 (%) |
|||||||
|---|---|---|---|---|---|---|---|---|---|---|---|---|---|---|
| # of Test Reports | Compliance Rate (%) | # of Test Reports | Compliance Rate (%) | # of Test Reports | Compliance Rate (%) | # of Test Reports | Compliance Rate (%) | # of Test Reports | Compliance Rate (%) | # of Test Reports | Compliance Rate | # of Test Reports | Compliance Rate | |
| Footwear | 4668 | 99.2 | 3512 | 98.4 | 2707 | 97.9 | 1781 | 96 | 1150 | 92.1 | 32.9 | 0.8 | 305.9 | 7.1 |
| Apparel | 1239 | 99.1 | 988 | 98 | 925 | 99.1 | 500 | 98 | 480 | 93.1 | 25.4 | 1.1 | 158.1 | 6.0 |
| Accessories | 639 | 96.2 | 764 | 97.1 | 753 | 96 | 677 | 94 | 624 | 92.0 | -16.4 | -0.9 | 2.4 | 4.3 |
| Others | 59 | 100.0 | 54 | 100 | 44 | 95.5 | 78 | 94 | 82 | 93.9 | 9.3 | 0.0 | -28.0 | 6.1 |
| Total | 6605 | 98.9 | 5318 | 98.1 | 4429 | 97.8 | 3028 | 96 | 2336 | 92.3 | 24.2 | 0.8 | 182.7 | 6.6 |
At manufacturing level, we phased out the intentional use of 11 priority chemical groups classified as particularly hazardous as part of our Greenpeace Detox commitment. This phase-out was supported by the increasing use of bluesign® and OEKO-TEX certified materials as well as substituting PFC-based water-repellent finishes. We also trained our supplier base, for example during supplier round table meetings. While most of those chemical groups were never intentionally used in the first place, poly-fluorinated chemicals (PFCs) were used until 2017 for water-repellent finishes on apparel and footwear products.
The phase-out of these substances is illustrated by the results of wastewater tests by our core wet-processing suppliers. These tests show compliance levels of over 94% for each of the Manufacturing Restricted Substance List (MRSL) parameters listed in the ZDHC MRSL. Most parameters show compliance rates of 100% or close to 100%, with the exception of harmful AZO Dyes (94.2% compliance) and PFCs (95% compliance). Those two parameters were already phased out by PUMA, but due to shared production with other brands and retails at the same suppliers could still be found in a small number of samples.
With the help of our footwear suppliers, we also managed to further reduce the amount of solvents or volatile organic compounds (VOCs) per pair of shoes to 15.6 g/pair in line with our 2020 target projection. We achieved this reduction by frequent VOC reduction meetings with our footwear suppliers and chemical companies. In those meetings we shared best practices from leading suppliers and new technological developments.
* 2019 figure based on core suppliers, in alignment with general reporting scope.
Target Description:
Industry good practice for effluent treatment is met by 90% of PUMA core suppliers with wet processing facilities. Industry good practice for air emissions is met by 90% of PUMA core suppliers with significant air emissions.
Relates to United Nations Sustainable Development Goal 6
Examples for the 10FOR20 Action Plan:
KPIs:
Since 2015, we increased the amount of wastewater testing from 33 suppliers to 70 suppliers and 125 test reports, thereby covering 90% of all core suppliers with industrial wet-processing facilities.
The test results imply that the phase-out of priority hazardous chemicals has been largely completed as planned. On the testing results of conventional wastewater parameters, which are only applicable to suppliers which directly discharge their wastewater into natural water bodies, 16 out of 17 measured parameters show equally high compliance levels of 90% or above.
One parameter, namely coliform bacteria* (70%) remained below our 90% compliance threshold against the ZDHC wastewater quality guidelines. We will work with the 30% non-compliant suppliers on the installation of disinfection units to hit the coliform bacteria target as well.
To further improve the wastewater quality performance, we initiated wastewater treatment training, starting in Greater China. While waiting for more training being offered by the ZDHC, our plan is to provide training sessions in all of our major sourcing regions.
Our air emissions target aims for an industry good practice standard for air emissions. This standard is under development by the ZDHC and PUMA actively supports the standard development.
Therefore, we consider that we have not yet met both the water and air targets for 2020. We will move these targets forward to our next target period for 2025.
* Coliform bacteria are universally present in large numbers in the feces of warm-blooded animals (or humans). While coliforms themselves are not normally causes of serious illness, they are easy to culture, and their presence is used to indicate that other pathogenic organisms of fecal origin may be present https://en.wikipedia.org/wiki/Coliform_bacteria
Target Description:
Use sustainable material alternatives for PUMA’s key materials: cotton, polyester, leather, polyurethane and cardboard.
Relates to United Nations Sustainable Development Goals 12,15
Examples for the 10FOR20 Action Plan:
KPIs:
The PUMA Environmental Profit and Loss Account attributes more than 50% of PUMA’s environmental impact to material and raw material production. Therefore we have placed a high priority on the large-scale use of more sustainable raw materials. As part of our 10FOR20 strategy, we set targets for more sustainable raw materials used in our apparel, such as cotton and polyester, but also for footwear leather, polyurethane and cardboard.
With the exception of polyurethane (PU), we had already achieved our targets by the end of 2018. We therefore increased our level of ambition for certified cotton and polyester from 50% to 90%, and added OEKO-TEX to the list of applicable certification standards for polyester. Our material sourcing teams instructed our material vendors to purchase more sustainable cotton and certified polyester where feasible. This effort was supported by increased demand from our business units for more sustainable materials at product level. The results are 82% cotton from the Better Cotton Initiative and organic cotton, and 98% certified polyester in our apparel ranges and exclusive use of certified polyester in our accessories division.
Regarding more sustainable PU, we piloted water-based PU in 2018 and so far have sold approximately 300,000 pairs of sneakers using water-based PU. While we found some technical limitations in the use of water-based PU, the significant price increase compared to conventional PU has so far prevented us from further increasing the use of this material. We hope that together with our industry peers we can scale up the production volume of water-based PU and eliminate any technical issues as well as bring the price down to a competitive level.
| Division | Material Targets | % of Total 2015 | % of Total 2016 | % of Total 2017 | % of Total 2018 | % of Total 2019 | Target 2020 |
|---|---|---|---|---|---|---|---|
| Apparel | Cotton from BCI | 3% (organic) | 19% | 40% | 50% | BCI+Organic: 82% BCI cotton: 80% Organic cotton: 2% |
50% (90%) |
| bluesign® certified Polyester | 15% | 24% | 47% | 66% | bluesign®-, OEKO-TEX-, Recycled: 98% bluesign®: 55% OEKO-TEX: 42% Recycled: 1% |
50% (90%) | |
| Accessories | bluesign® certified Polyester | 20% | 21% | 34% | 46% | bluesign®-, OEKO-TEX: 100% bluesign: 54% Oeko-Tex: 46% |
50% (90%) |
| Footwear | FSC® certified and/or recycled Paper&Cardboard | 85% | 78% | 95% | 92% | Product Packaging 100% | 90% |
| Footwear | LWG Medal Rated Leather | 99% | 94% | 99% | 99% | 98% | 90% |
Apart from our original targets on BCI cotton and certified polyester, we also started using recycled polyester and organic cotton for some of our sustainability focused collections.
Target Description:
Continue to report on the EP&L every year.
Relates to United Nations Sustainable Development Goals 7,12
Examples for the 10FOR20 Action Plan:
KPI:
Following PUMA‘s spin-off from Kering, we re-integrated the calculation of the PUMA EP&L into our own sustainability efforts. The year 2019 was a transition year to migrate the EP&L systems into our own IT landscape. At the end of the year, we were able to calculate our 2018 EP&L results: (https://about.puma.com/en/sustainability/environment)

* without value-channel footwear
Based on our 10FOR20 targets, we are reporting on PUMA’s progress towards gradually lowering the EP&L value relative to our financial revenue. While there was an increase in EP&L Value from 2017 to 2018, mainly caused by a more detailed material analysis, the overall trend between 2013 and 2018 remains positive with a decrease of EP&L value per revenue of 13.6%.
* without value-channel footwear
For an overview of the environmental KPIs of PUMA entities and its core tier 1 suppliers, please see table 10. Together with data on our material consumption and manufacturing locations (tables 11 and 12 below), these figures form the basis of the PUMA EP&L.
| 2019 | 2018 | 2017 | 2016 | 2015 | % Change 2019/18 |
% Change 2019/2015 |
|
|---|---|---|---|---|---|---|---|
| Energy | |||||||
| Excl. RECs: | |||||||
| Electricity consumption (MWh) | 61,499 | 66,512 | 64,119 | 63,339 | 59,888 | -7.5 | 2.7 |
| Electricity consumption from renewable tariff (MWh) | 11,547 | 11,695 | 11,611 | 12,049 | 11,360 | -1.3 | 1.7 |
| Percentage renewable electricity consumption | 16% | 15% | 18% | 19% | 19% | ||
| Incl. RECs: | |||||||
| Electricity consumption (MWh) | 61,499 | 66,512 | 64,119 | 63,339 | 59,888 | -7.5 | 2.7 |
| Electricity consumption from renewable tariff (MWh) | 48,816 | 36,746 | 11,611 | 12,049 | 11,360 | 32.8 | 329.7 |
| Percentage renewable electricity consumption | 79% | 55% | 18% | 19% | 19% | ||
| Energy from non-renewable fuels (oil, natural gas, etc.) (MWh) | 10,975 | 11,724 | 14,430 | 12,593 | 14,314 | -6.4 | -23.3 |
| Energy from steam (MWh) | 7,915 | 5,734 | 5,155 | 5,775 | 5,029 | 38.0 | 57.4 |
| Total Energy Consumption | 80,389 | 83,970 | 83,704 | 81,707 | 79,231 | -4.3 | 1.5 |
| Energy consumption from PUMA production (MWh)* | 246,160 | 195,866 | 194,881 | 180,041 | 149,709 | 25.7 | 64.4 |
|
* Includes suppliers of tier 1
|
|||||||
| 2019 | 2018 | 2017 | 2016 | 2015 | % Change 2019/18 |
% Change 2019/2015 |
|
|---|---|---|---|---|---|---|---|
| Waste, paper and water | |||||||
| Waste (tons) | 3,154 | 4,877 | 5,293 | 5,302 | 5,007 | -35.3 | -37.0 |
| Recycled waste (tons) | 1,111 | 2,282 | 3,419 | 3,275 | 2,949 | -51.3 | -62.3 |
| Percentage recycled waste | 35% | 47% | 65% | 62% | 59% | ||
| Waste from PUMA produktion [T]* | 24,205 | 16,682 | 14,686 | 12,257 | 11,433 | 45.1 | 111.7 |
| Paper and cardboard consumption [T]** | 2,281 | 2,292 | 2,756 | 3,337 | 3,465 | -17.2 | -34.2 |
| Certified or recycled paper and cardboard consumption [T] | 1,818 | 1,120 | 2,025 | 2,512 | 2,498 | 62.3 | -27.2 |
| Percentage certified or recycled paper consumption | 80% | 49% | 74% | 75% | 72% | ||
| Paper and cardboard consumption from PUMA production [T]* | 14,863 | 13,607 | 14,129 | 15,269 | 13,357 | 9.2 | 11.3 |
| Water (m3) | 95,291 | 89,676 | 106,397 | 107,025 | 104,221 | 6.3 | -8.6 |
| Water from PUMA production (thous. m3)* | 2,572 | 2,030 | 2,149 | 2,145 | 1,774 | 26.7 | 45.0 |
|
* Includes suppliers of tier 1 ** Including paper bags, direct and indirect paper and cardboard consumption
|
|||||||
We have worked with our core suppliers for almost 10 years on energy efficiency as well as reducing water consumption and waste, for example as part of the Vietnam Improvement Program (VIP) or the Partnership for Cleaner Textiles (PaCT) run by the IFC.
The results of these efforts are visible in a positive overall trend of energy and water consumption per pair or piece of product since 2015, although we see a slight increase in average footwear figures due to changes in our supplier base. New factories had been setup but were not running as efficiently as existing production lines, which caused this slight increase. Going forward, we will work with our suppliers on increasing the efficiency of the new production lines and set new targets to reduce the amount of waste.
| Summary of Supplier e-KPIs | Weighted | Change | Range 2019 | |||||||
|---|---|---|---|---|---|---|---|---|---|---|
| Value | Value 2015 | Value 2016 | Value 2017 | Value 2018 | Value 2019 | 2019-2018 | 2019-2015 | Min | Max | Number of Suppliers |
| Energy/pair (kWh) | 1.53 | 1.59 | 1.40 | 1.25 | 1.30 | 4% | -15% | 0.40 | 2.08 | 24 |
| CO2/pair (kg) | 1.35 | 1.12 | 1.00 | 0.93 | 0.96 | 3% | -29% | 0.25 | 1.69 | 24 |
| Water/pair (l) | 18.30 | 18.37 | 14.50 | 12.30 | 15.21 | 24% | -17% | 1.03 | 61.51 | 24 |
| Waste/pair (g) | 113.59 | 105.22 | 115.90 | 108.51 | 126.66 | 17% | 12% | 8.51 | 230.89 | 24 |
| Summary of Supplier e-KPIs | Weighted | Change | Range 2019 | |||||||
|---|---|---|---|---|---|---|---|---|---|---|
| Value | Value 2015 | Value 2016 | Value 2017 | Value 2018 | Value 2019 | 2019-2018 | 2019-2015 | Min | Max | Number of Suppliers |
| Energy/piece (kWh) | 0.62 | 0.69 | 0.72 | 0.57 | 0.57 | 0% | -9% | 0.13 | 4.24 | 23 |
| CO2/piece (kg) | 0.36 | 0.39 | 0.31 | 0.26 | 0.24 | -6% | -33% | 0.07 | 2.40 | 23 |
| Water/piece (l) | 6.83 | 8.18 | 7.58 | 4.20 | 4.39 | 5% | -36% | 0.8 | 59 | 23 |
| Waste/piece (g) | 51.00 | 50.00 | 44.00 | 46.50 | 56.33 | 21% | 10% | 2 | 186 | 23 |
Since 2017, we also measure average environmental key performance indicators (E-KPIs) from the manufacturing of fabric as well as artificial and genuine leather. As we have included our main material suppliers into our energy and water efficiency programs and other brands have also expanded their resource efficiency programs at our shared material suppliers, we can see a positive performance trend. The notable improvements in reducing CO2 emissions can partially be attributed to changing boilers from coal or oil to less polluting fuel sources such as rice husk or natural gas.
| Summary of Supplier e-KPIs | Weighted/m2 | Change | Range 2019 | |||||
|---|---|---|---|---|---|---|---|---|
| Value | Value 2017 | Value 2018 | Value 2019 | 2019-2018 | 2019-2017 | Min | Max | Number of Suppliers |
| Energy/m2 (kWh) | 9.1 | 8.7 | 8.2 | -5% | -10% | 2.3 | 10.1 | 6 |
| CO2/m2 (kg) | 3.4 | 3.2 | 3.2 | 2% | -5% | 1.0 | 4.7 | 6 |
| Water/m2 (l) | 91.8 | 90.2 | 74.7 | -17% | -19% | 5 | 117 | 6 |
| Waste/m2 (kg) | 1.6 | 0.8 | 0.8 | -8% | -50% | 0.0 | 2 | 6 |
| Summary of Supplier e-KPIs | Weighted | Change | Range 2019 | |||||
|---|---|---|---|---|---|---|---|---|
| Value | Value 2017 | Value 2018 | Value 2019 | 2019-2018 | 2019-2017 | Max | Min | Number of Suppliers |
| Energy/t (kWh) | 13,679.11 | 13,386.80 | 12,636.3 | -6% | -8% | 35,208.4 | 2,707.4 | 17 |
| CO2/t (t) | 4.45 | 4.45 | 4.4 | -2% | -2% | 14.6 | 1.2 | 17 |
| Water/t (m3) | 119.30 | 122.78 | 105.5 | -14% | -12% | 229.0 | – | 17 |
| Waste/t (kg) | 299.59 | 70.63 | 62.08 | -12% | -79% | 532.4 | – | 17 |