Economic Report
General Economic Conditions
Global Economy
According to the winter forecast by the Kiel Institute for the World Economy (IFW Kiel) on December 11, 2018, the global economy slowed over the course of 2018. In addition to uncertainty caused by increasing trade policy conflicts – particularly between the United States of America and China – the tightening of monetary policy in the United States, in particular, contributed to the slowing down of growth. For 2018, IFW Kiel’s experts expect an increase in global gross domestic product (GDP) of 3.7%, which represents a slight reduction of 0.1% compared to its summer forecast.
The slowdown in economic development in 2018 is evident both in the advanced economies and in the emerging markets. While 2017 was marked by synchronous growth, 2018 saw differences in economic development between the individual countries and groups of countries increase. In the industrial nations, expansion in the United States continued at a faster pace, supported by significant fiscal stimuli, while the economies of the euro zone and Japan lost considerable momentum. In the emerging markets, growth slowed to varying degrees, partly due to poorer financing conditions due to a more restrictive monetary policy on the part of the US Federal Reserve. While large parts of Asia, Russia and parts of South America continued their growth trend, Argentina and Turkey fell into recession.
Sporting goods industry
The sporting goods industry continued to grow strongly in 2018. This development was primarily driven by higher private household income, which enabled an increase in consumer spending on sporting goods. The global fitness boom also continued in 2018. Plenty of movement, a healthy lifestyle, and the accompanying increase in free-time sporting activities are still in fashion worldwide across large parts of the population. At the same time, there continued to be a strong demand for sporting everyday clothes in 2018.
The e-commerce business was a strong driver of growth in the sporting goods industry in 2018. Many commercial opportunities were taken advantage of in order to improve the purchasing experience for consumers, such as mobile technology and social media. In terms of major sporting events of the last year, it was particularly the Football World Cup in Russia that supported the growth of the sporting goods industry.
Sales
Illustration of Sales Development in 2018 compared to the Outlook
PUMA’s 2017 Management Report had predicted a currency-adjusted growth in sales of around 10% for the financial year 2018. This forecast was increased several times throughout the year and PUMA then expected a currency-adjusted sales increase of between 14% and 16% for financial year 2018. PUMA was able to surpass the revised forecast for financial year 2018, exceeding the originally planned sales target.
More details on sales development are provided below.
Net Sales
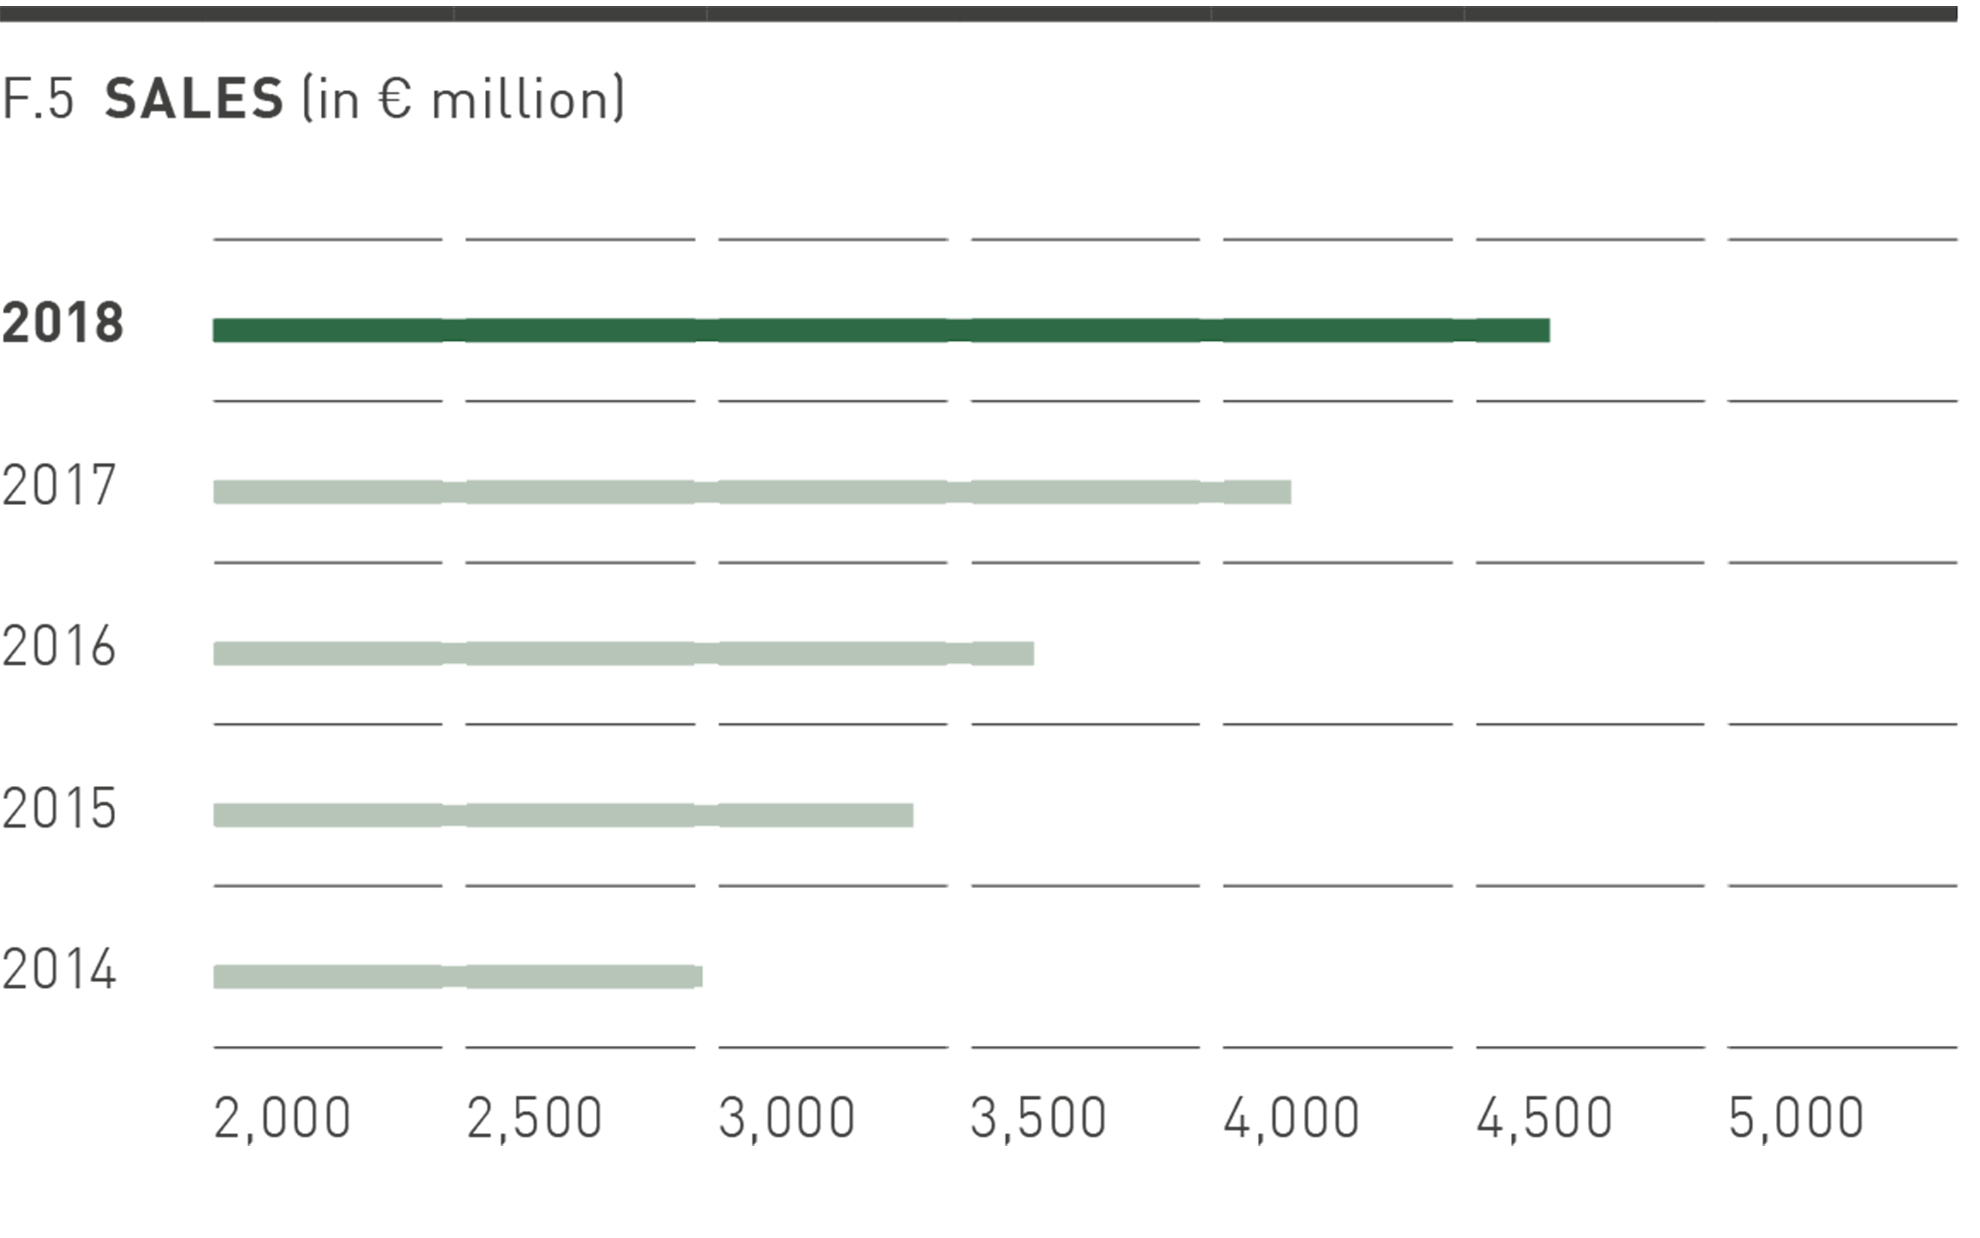
PUMA’s net sales rose in the financial year 2018 in the reporting currency, the Euro, by 12.4% to € 4,648.3 million. Currency-adjusted sales increased by 17.6%. In particular, the Asia / Pacific region, driven by China, showed a strong double-digit growth in sales. In terms of products, apparel was the main driver of sales growth.
The most important segment for PUMA – footwear – recorded a growth trend persistent for 18 quarters at the end of financial year 2018. The strongest growths were in the Sportstyle and Running and Training categories. Sales increased in the reporting currency, the Euro, by 10.6% to € 2,184.7 million, meaning that the footwear segment exceeded the sales mark of € 2 billion for the first time. Currency-adjusted sales growth of 16.6% was achieved. The proportion of this segment in total sales fell slightly from 47.7% in the previous year to 47.0% in 2018.
In the apparel segment, sales increased in the reporting currency, the Euro, by 17.1% to € 1,687.5 million. Currency-adjusted sales increased by 22.2%. The Sportstyle category was the main driver of sales growth. In addition, the introduction of new products in the Teamsport and Motorsport categories contributed to this growth. The apparel segment accounted for 36.3% of Group sales (previous year: 34.9%).
In the accessories segment, sales increased in the reporting currency, the Euro, by 7.8% to € 776.1 million. This represents a currency-adjusted increase of 11.0%. The increase resulted particularly from higher sales of socks and bodywear. Its share in Group sales reduced slightly from 17.4% in the previous year to 16.7% in 2018.
Retail Businesses
PUMA’s retail activities include direct sales to our consumers (“Direct to Consumer business”). This includes PUMA’s own retail stores, the so-called “Full Price Stores”, “Factory Outlets”, and e-commerce online sales. Our own retail store activities ensure regional availability of PUMA products and the presentation of the PUMA brand in an environment suitable to our brand positioning.
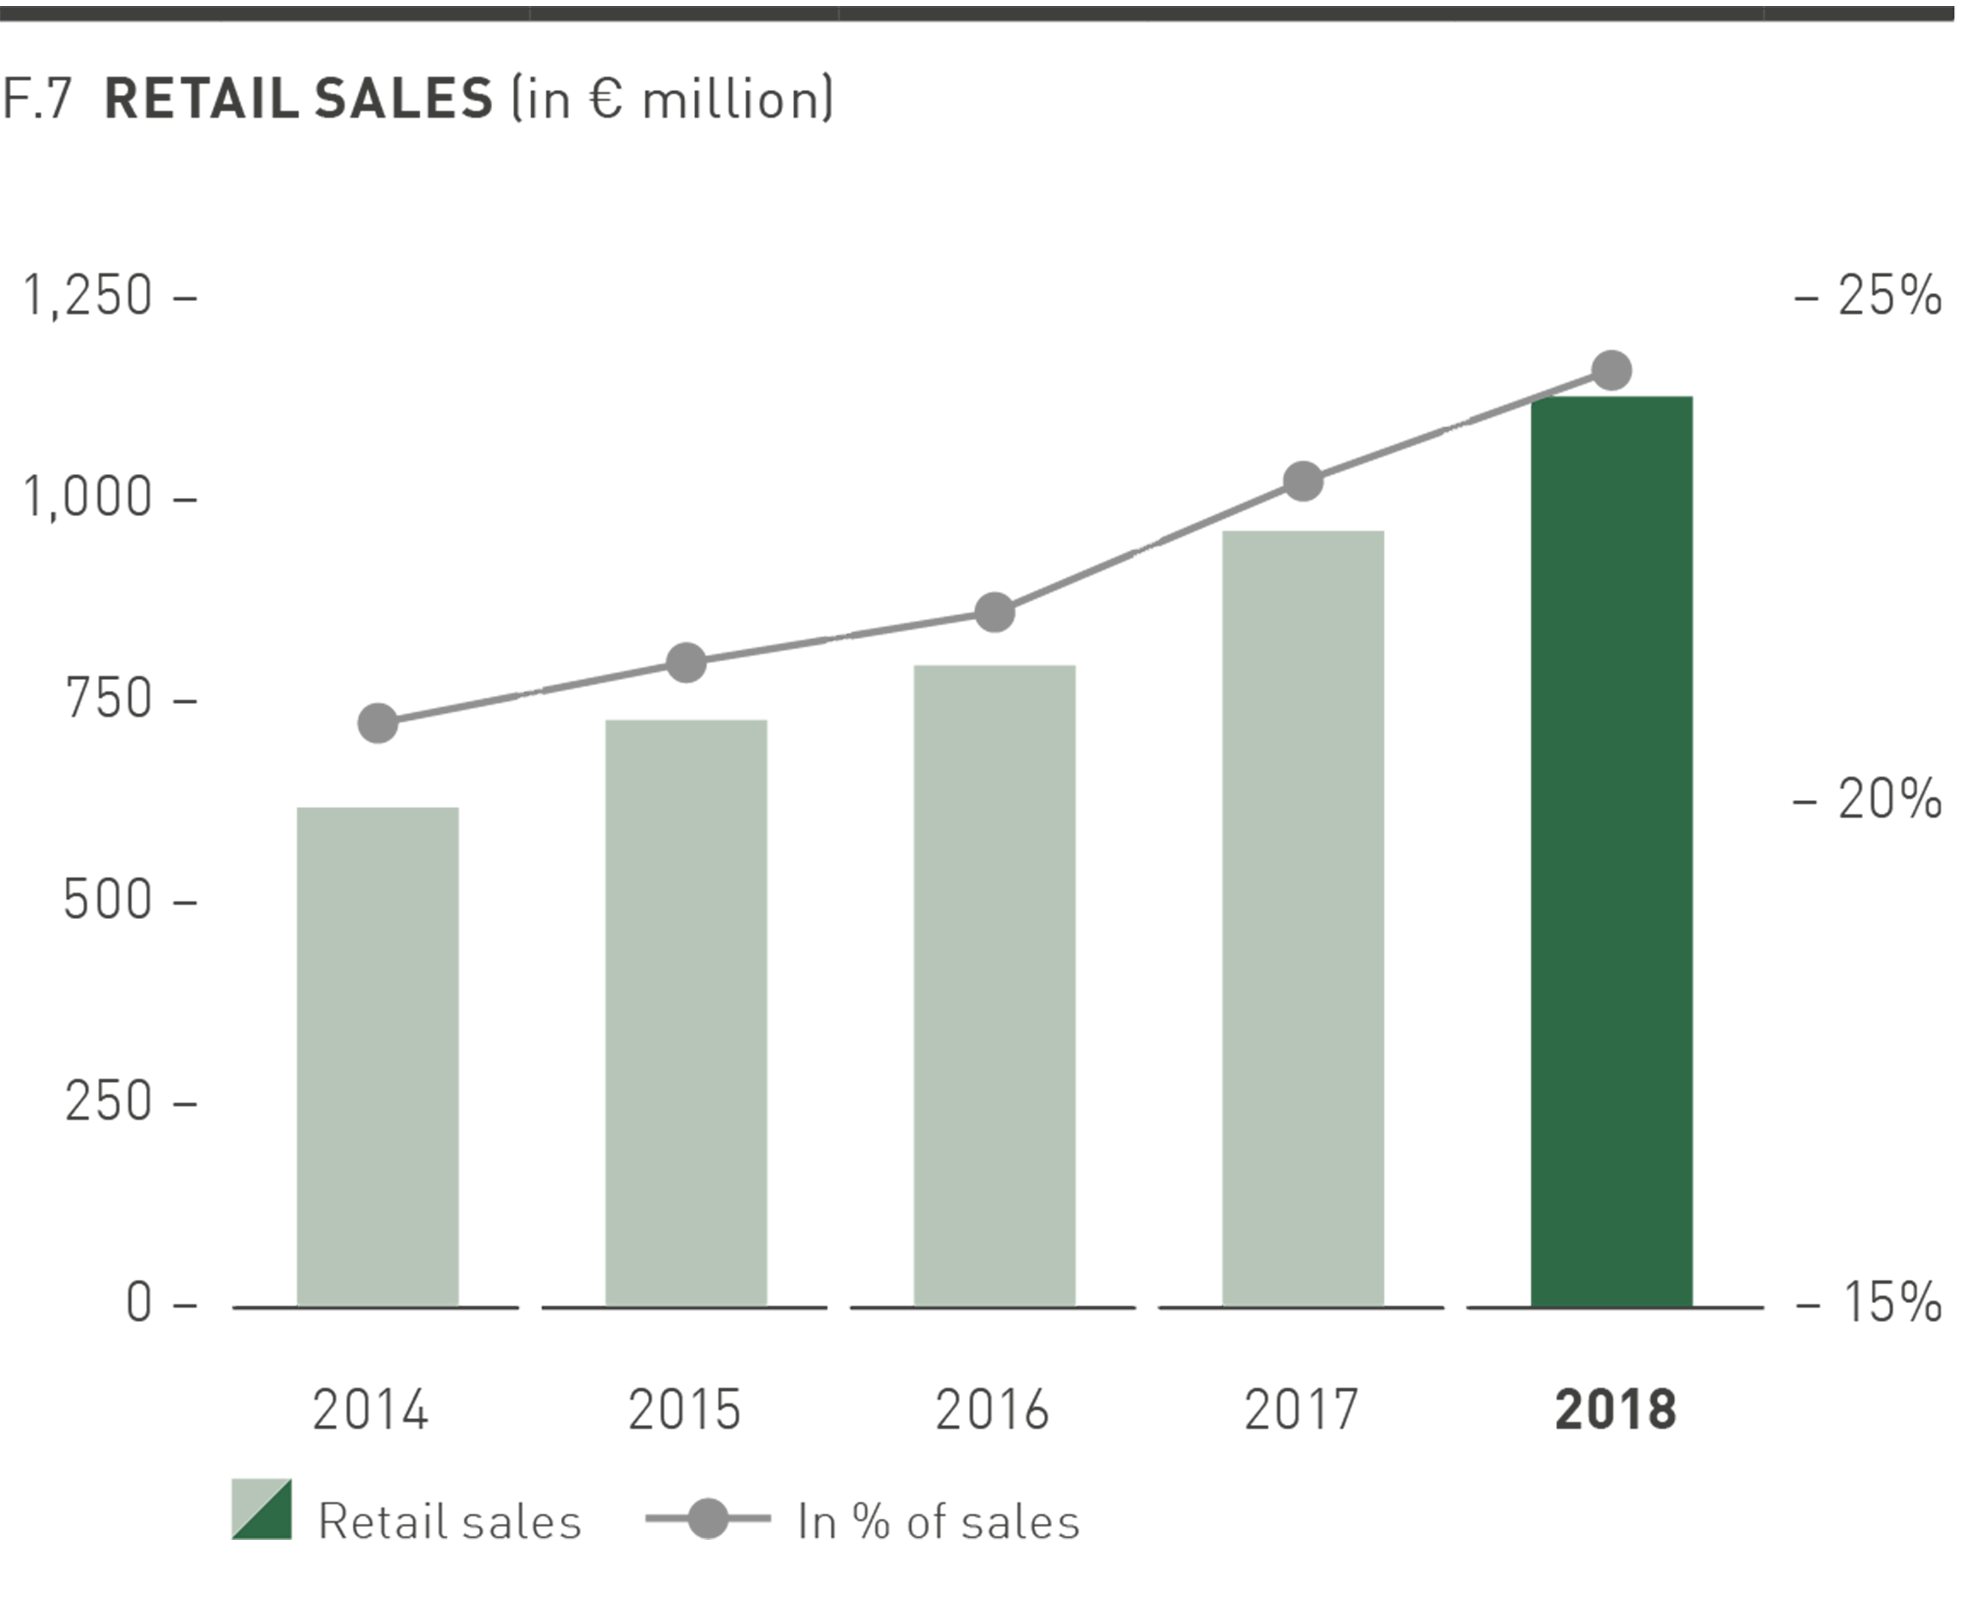
PUMA’s retail sales increased in the financial year 2018 by a currency-adjusted 24.0% to € 1,127.5 million. This corresponds to a 24.3% share in total sales (previous year: 23.2%). The increase of PUMA’s retail sales resulted from both the increase in sales on a comparable floor area basis compared to last year and from the targeted expansion of our portfolio of own retail stores. In addition to the opening of additional retail stores at selected locations worldwide, optimizing the portfolio also included modernizing existing retail stores in line with the FOREVER FASTER store concept. This makes it possible to present PUMA products and related technologies in an even more attractive environment and strengthens PUMA’s position as a sports brand.
Our e-commerce business recorded a far above-average growth in 2018. This was brought about by, for example, the expansion of the product range in online stores worldwide and by our targeted sales promotions in the online business. In addition, our e-commerce activities on special days in the online business such as Singles’ Day in China on November 11 and the world’s biggest online shopping day, known as “Black Friday / Cyber Monday”, turned out to be particularly successful.
Licensing Business
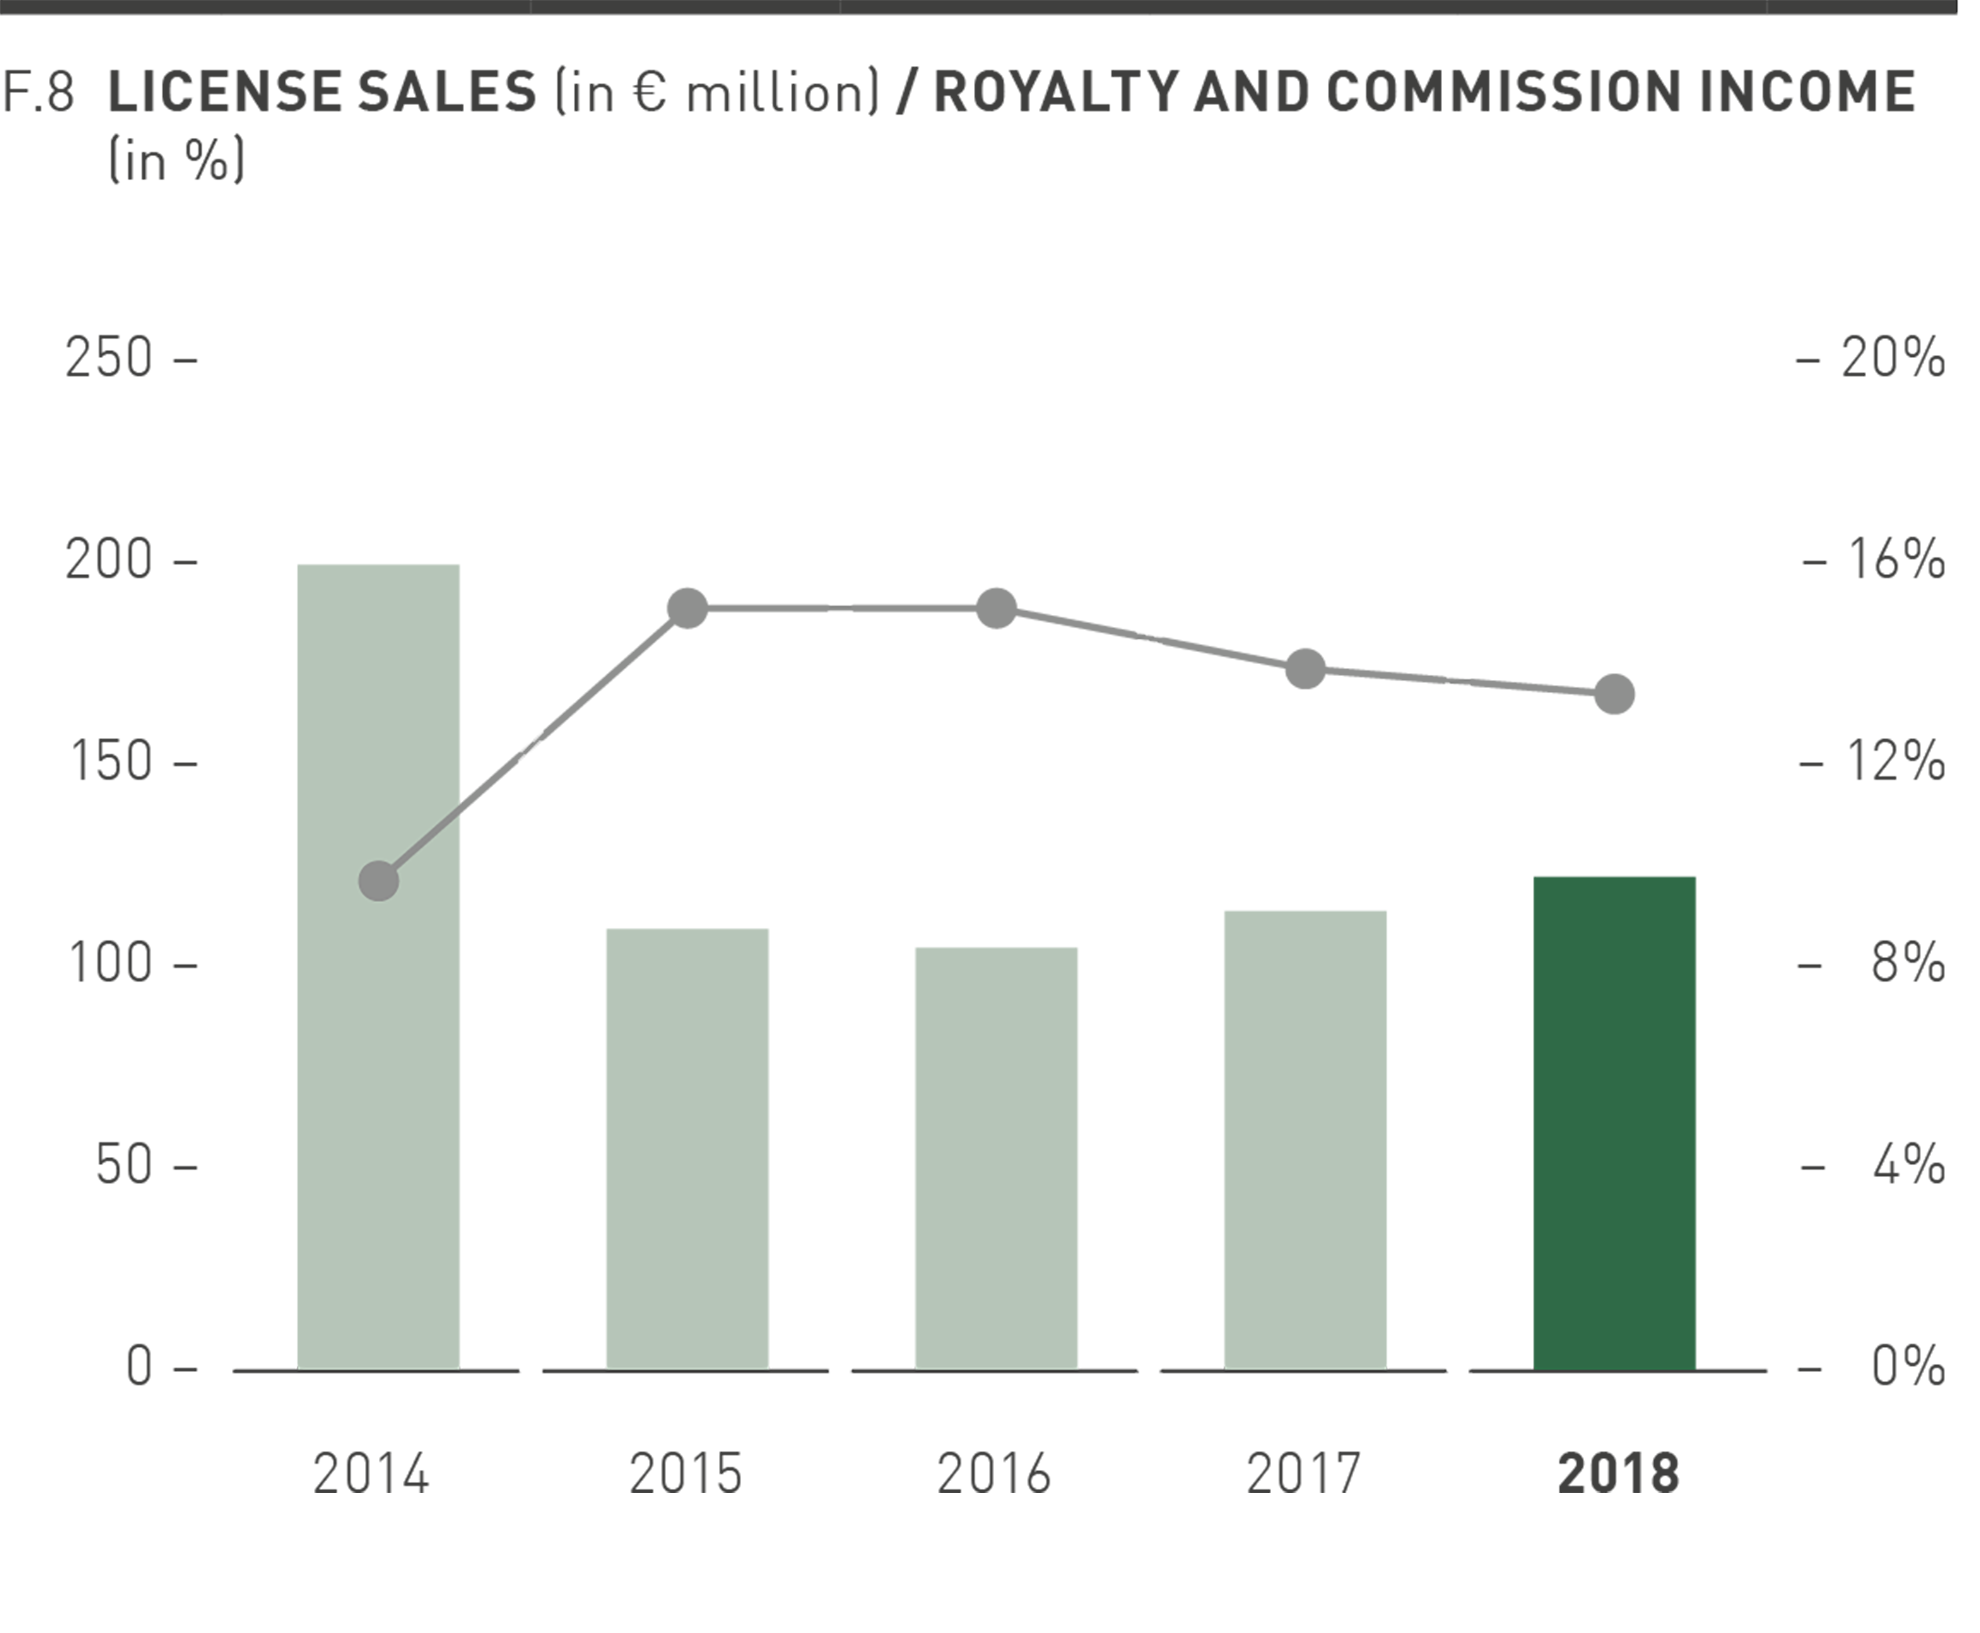
For various product segments, such as fragrances, eyewear, and watches, PUMA issues licenses authorizing independent partners to design, develop, manufacture, and sell these products. Revenue from license agreements also includes some sales licenses for various markets. License sales, which are not part of PUMA’s consolidated sales, but which are, however, the basis for PUMA’s licensing and commission income, increased in 2018 in the reporting currency, the Euro, by 7.4% to € 121.9 million. PUMA’s resulting licensing and commission income increased in 2018 by 3.2% to € 16.3 million.
Regional Development
In the following explanation of the regional distribution of sales, the sales are allocated to the respective region of the customer (“Customer Site”). It is divided into three geographic regions (EMEA, America and Asia / Pacific). A more detailed regional presentation of the sales according to the registered office of the respective Group company can be found in chapter 26 in the Notes to the Consolidated Financial Statements.
PUMA’s sales increased in 2018, by currency-adjusted 17.6%. All regions contributed to this currency-adjusted development with double-digit growth rates.
In the EMEA region, sales rose in the reporting currency, the Euro, by 9.4% to € 1,800.3 million. This corresponds to a currency-adjusted increase in sales of 11.4%. A particularly strong increase came from France, Spain and the United Kingdom (UK), which showed double-digit growth in sales. Russia, Ukraine, Turkey and the United Arab Emirates also grew strongly with double-digit growth rates. However, the strength of the Euro against, for example, the Turkish Lira led to significant negative currency exchange effects on sales in the reporting currency, the Euro.
The EMEA region accounted for 38.7% of Group sales in 2018 in comparison to 39.8% last year.
In terms of the product segments, sales of footwear recorded a currency-adjusted increase of 8.6%. Sales from apparel increased by a currency-adjusted 18.4% and sales from accessories grew by a currency-adjusted 6.6%.
Sales in the America region increased in the reporting currency, the Euro, by 7.9% to 1,612.5 million. Currency-adjusted sales rose by 16.9%, with both North and Latin America showing double-digit growth rates and thereby contributing to the increase in revenue. The weakness of the Argentine Peso against the Euro did, however, lead to significant negative currency exchange effects on sales in the reporting currency, the Euro. The share of the America region in Group sales decreased from 36.1% in the previous year to 34.7% in 2018.
In terms of the product segments, both footwear (currency-adjusted +11.7% compared to the previous year), apparel (+25.2%), and accessories (+17.7%) showed very good double-digit growth.
In the Asia / Pacific region, sales growth was particularly strong. Here, sales increased in the reporting currency, the Euro, by 24.2% to € 1,235.5 million. This corresponds to a currency-adjusted increase in sales of 28.8%. The main drivers of growth in the region were Greater China and Korea, which each showed an above-average double-digit growth rate. By contrast, sales in Japan grew moderately compared to the previous year with a high single-digit percentage rate. The share of the Asia / Pacific region in Group sales increased from 24.1% in the previous year to 26.6% in 2018.
In the product segments, sales from footwear increased by a currency-adjusted 37.9%. Sales from apparel increased by a currency-adjusted 23.9% and accessories recorded a rise in sales of a currency-adjusted 7.2%.
Illustration of Earnings Development in 2018 compared to the Outlook
In the outlook of the 2017 Annual Report, PUMA forecasted a slight improvement in the gross profit margin for financial year 2018. PUMA expected an increase in a mid-to-high single-digit percentage rate for other operating income and expenses. The forecast for the operating result (EBIT) was within a range of between € 305 million and € 325 million. In addition, a significant improvement in net earnings was expected.
These forecasts were raised slightly several times during the year and PUMA thereafter expected an improvement in the gross profit margin of around 100 basis points compared to the previous year (2017: 47.3%), an increase in other operating income and expenses in the low double-digit percentage range and an operating result (EBIT) within a range of between € 325 million and € 335 million.
In accordance with the previous forecasts, Management expected a significant improvement in net earnings for the financial year 2018.
PUMA was able to fully achieve the increased forecasts in 2018, and even slightly exceed them. This means that PUMA exceeded the originally targeted improvement in operating result for 2018.
More details on earnings development are provided below.
Gross Profit Margin
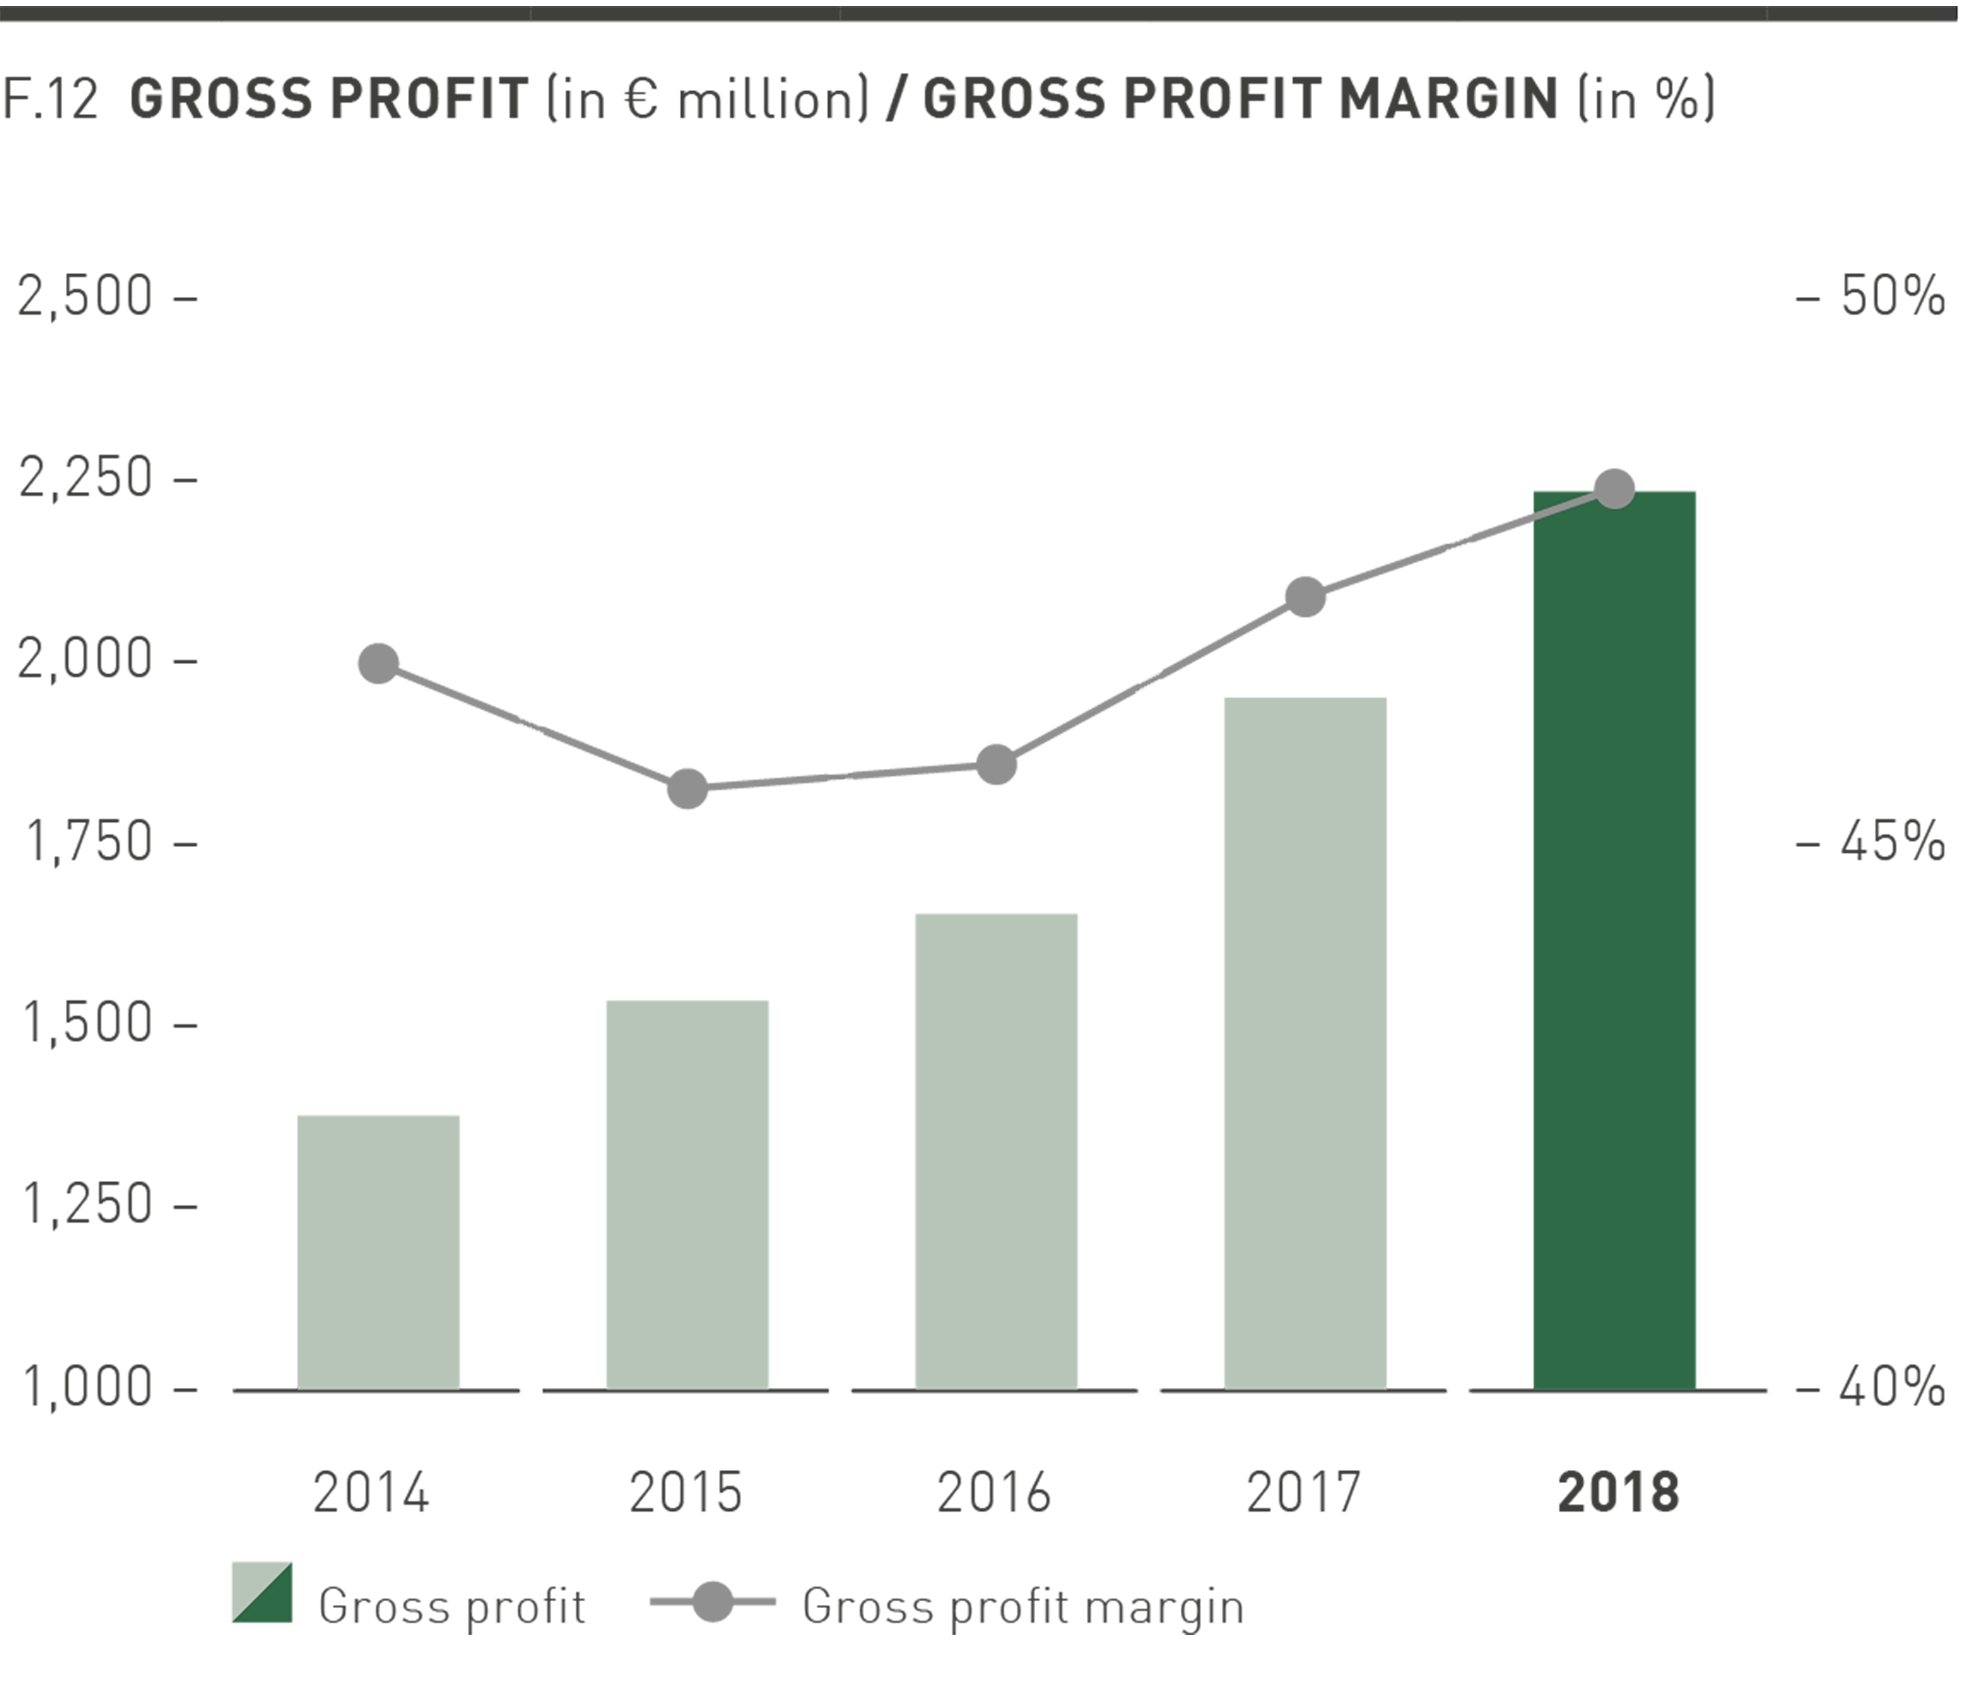
Gross profit improved in the financial year 2018 by 15.1% from € 1,954.3 million to € 2,249.4 million. The gross profit margin increased by 110 basis points from 47.3% to 48.4%, particularly because of improvements in sourcing and higher sales of new products with a higher margin. In addition, the higher share of own retail sales and the development of the regional sales mix had a small positive effect on the gross profit margin. In 2018, there were no exchange rate effects on the gross profit margin compared with the previous year, as effects during the year offset each other on a full-year basis.
The gross profit margin in the footwear segment increased from 45.5% in the previous year to 45.8% in 2018. The apparel gross profit margin improved from 49.0% to 50.9% and the gross profit margin for accessories also increased from 48.5% to 50.3%.
Other Operating Income and Expenses
In the past financial year, further planned investment was made in marketing so as to increase PUMA’s brand heat and to position PUMA as the fastest sports brand in the world. Investments in the modernization of our own retail stores and in the opening of further retail stores also continued. Furthermore, progress was made in modernizing our IT infrastructure. This led to an overall increase in operating income and expenses in the financial year 2018 of 11.8% from € 1,725.6 million to € 1,928.4 million. As a percentage of sales, the cost ratio improved from 41.7% to 41.5%. The decrease in the cost ratio confirms the consistent focus on the strict control of other operating income and expenses, which continues to be a high priority for PUMA, and which contributed to the improvement of the operating result in the financial year 2018.
Within sales expenses, the expenses for marketing / retail grew by 13.2% from € 822.9 million to € 931.2 million. This development is primarily connected to the consistent implementation of the FOREVER FASTER brand campaign and the increased number of own retail stores. At 20.0% of sales, the cost ratio remained almost unchanged compared to the previous year. Other sales expenses, which mainly include sales-related variable costs and transportation costs, increased by 19.1% to € 592.4 million. This increase is primarily due to higher sales-related expenses from operating our own retail stores and from the e-commerce business. The cost ratio of other sales expenses in 2018 was 12.7% of sales.
Research and Development / Product Management expenses remained almost stable compared to the previous year at € 97.8 million and the cost ratio fell slightly to 2.1%. Other operating income in the past financial year amounted to € 21.1 million and consisted primarily of income arising from the release of provisions. Administrative and general expenses increased in 2018 by 6.9% from € 307.0 million to € 328.1 million. The slight increase resulted from, amongst other things, higher expenses in warehousing, logistics and IT. The cost ratio of administrative and general expenses decreased from 7.4% to 7.1%. Depreciation / amortization are included in the relevant costs and total € 81.5 million (previous year: € 70.3 million). This represents a 15.9% increase in depreciation / amortization compared to the previous year.
Operating result (EBIT)
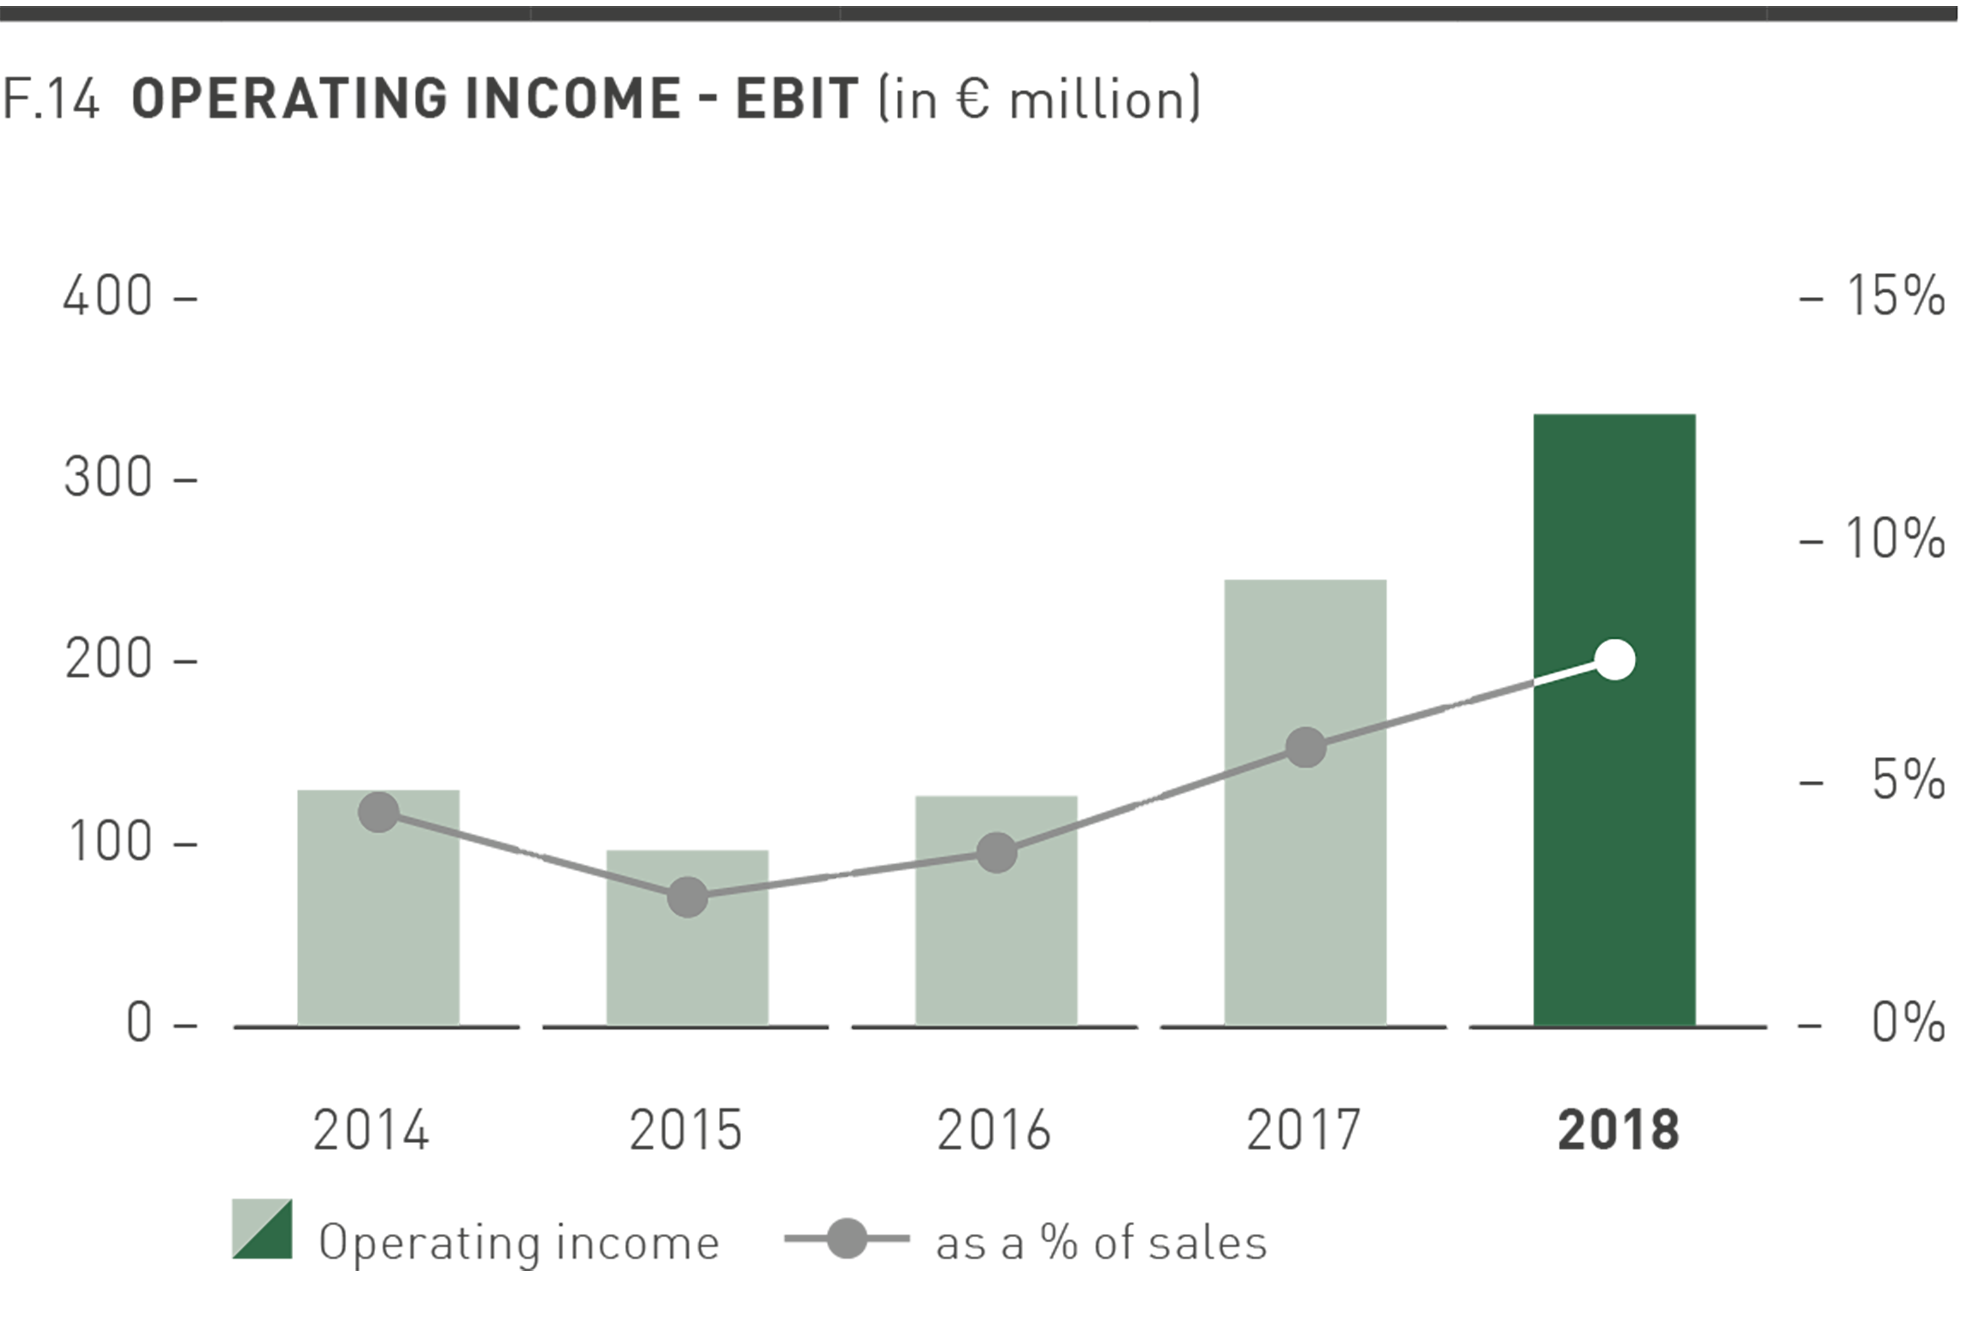
Operating result increased by 37.9% from € 244.6 million in the previous year to € 337.4 million in 2018. This result is slightly above the adjusted EBIT forecast within a range of between € 325 million and € 335 million. The significant improvement in profitability in 2018 resulted from the strong growth in sales combined with the improvement in the gross profit margin. The EBIT margin rose accordingly from 5.9% in the previous year to 7.3%.
Financial Result
The financial result decreased in 2018 from € -13.4 million in the previous year to € -24.0 million. This development was primarily due to the increase in expenses from currency conversion differences from € 6.9 million in the previous year to € 14.4 million in 2018.
Financial income improved slightly from € 10.3 million in the previous year to € 11.6 million in 2018. Financial income includes interest income of € 4.0 million (previous year: € 4.1 million) and income from interest components related to currency hedging contracts of € 7.6 million (previous year: € 6.3 million). In contrast, however, there was a slight increase in interest expenses from € 14.3 million to € 15.1 million. The remaining financial expenses arising from the valuation of pension plans and from interest components related to currency hedging contracts amounted to € 4.5 million in 2018 (previous year: € 4.2 million). The result from associated companies, which is included in the financial result, was € -1.5 million in the financial year 2018 (previous year: € 1.6 million).
Earnings before taxes (EBT)
In the financial year 2018, PUMA generated earnings before taxes of € 313.4 million, an improvement of 35.5% from the previous year (€ 231.2 million). Tax expenses were € 83.6 million compared to € 63.3 million in the previous year, and the tax ratio decreased slightly from 27.4% to 26.7% in 2018.
Net Earnings Attributable to Non-controlling Interests
Net earnings attributable to non-controlling interests relate to companies in the North American market, in each of which the same shareholder holds a minority stake. The earnings attributable to this shareholder increased in the financial year 2018 by 31.7% to € 42.4 million (previous year: € 32.2 million). These companies concern Janed, which distributes socks and bodywear, PUMA Accessories North America and PUMA Kids Apparel that focuses on selling clothing for children, and their respective subsidiaries in Canada.
Net Earnings
Net earnings increased in the financial year 2018 by 38.0% from € 135.8 million to € 187.4 million. The significant improvement in net earnings mainly resulted from the strong growth in sales combined with the improvement in the gross profit margin. While the financial result decreased in 2018, the slight decline in the tax rate had a positive effect on net earnings. Earnings per share and diluted earnings per share increased accordingly by 38.0% to € 12.54 compared to € 9.09 in the previous year.
Dividends
The Management Board and the Supervisory Board will propose to the Annual General Meeting on April 18, 2019, to distribute a regular dividend of € 3.50 per share for the financial year 2018 from PUMA SE’s retained earnings under commercial law. As a percentage of net earnings, the payout ratio amounts to 27.9%. This is in accordance with the current dividend policy of PUMA SE, which foresees a payout ratio of 25% to 35% of net earnings. The dividends will be distributed in the days following the Annual General Meeting at which the resolution on the distribution is adopted. In the previous year, a one-time special dividend of € 12.50 was distributed.
Equity Ratio
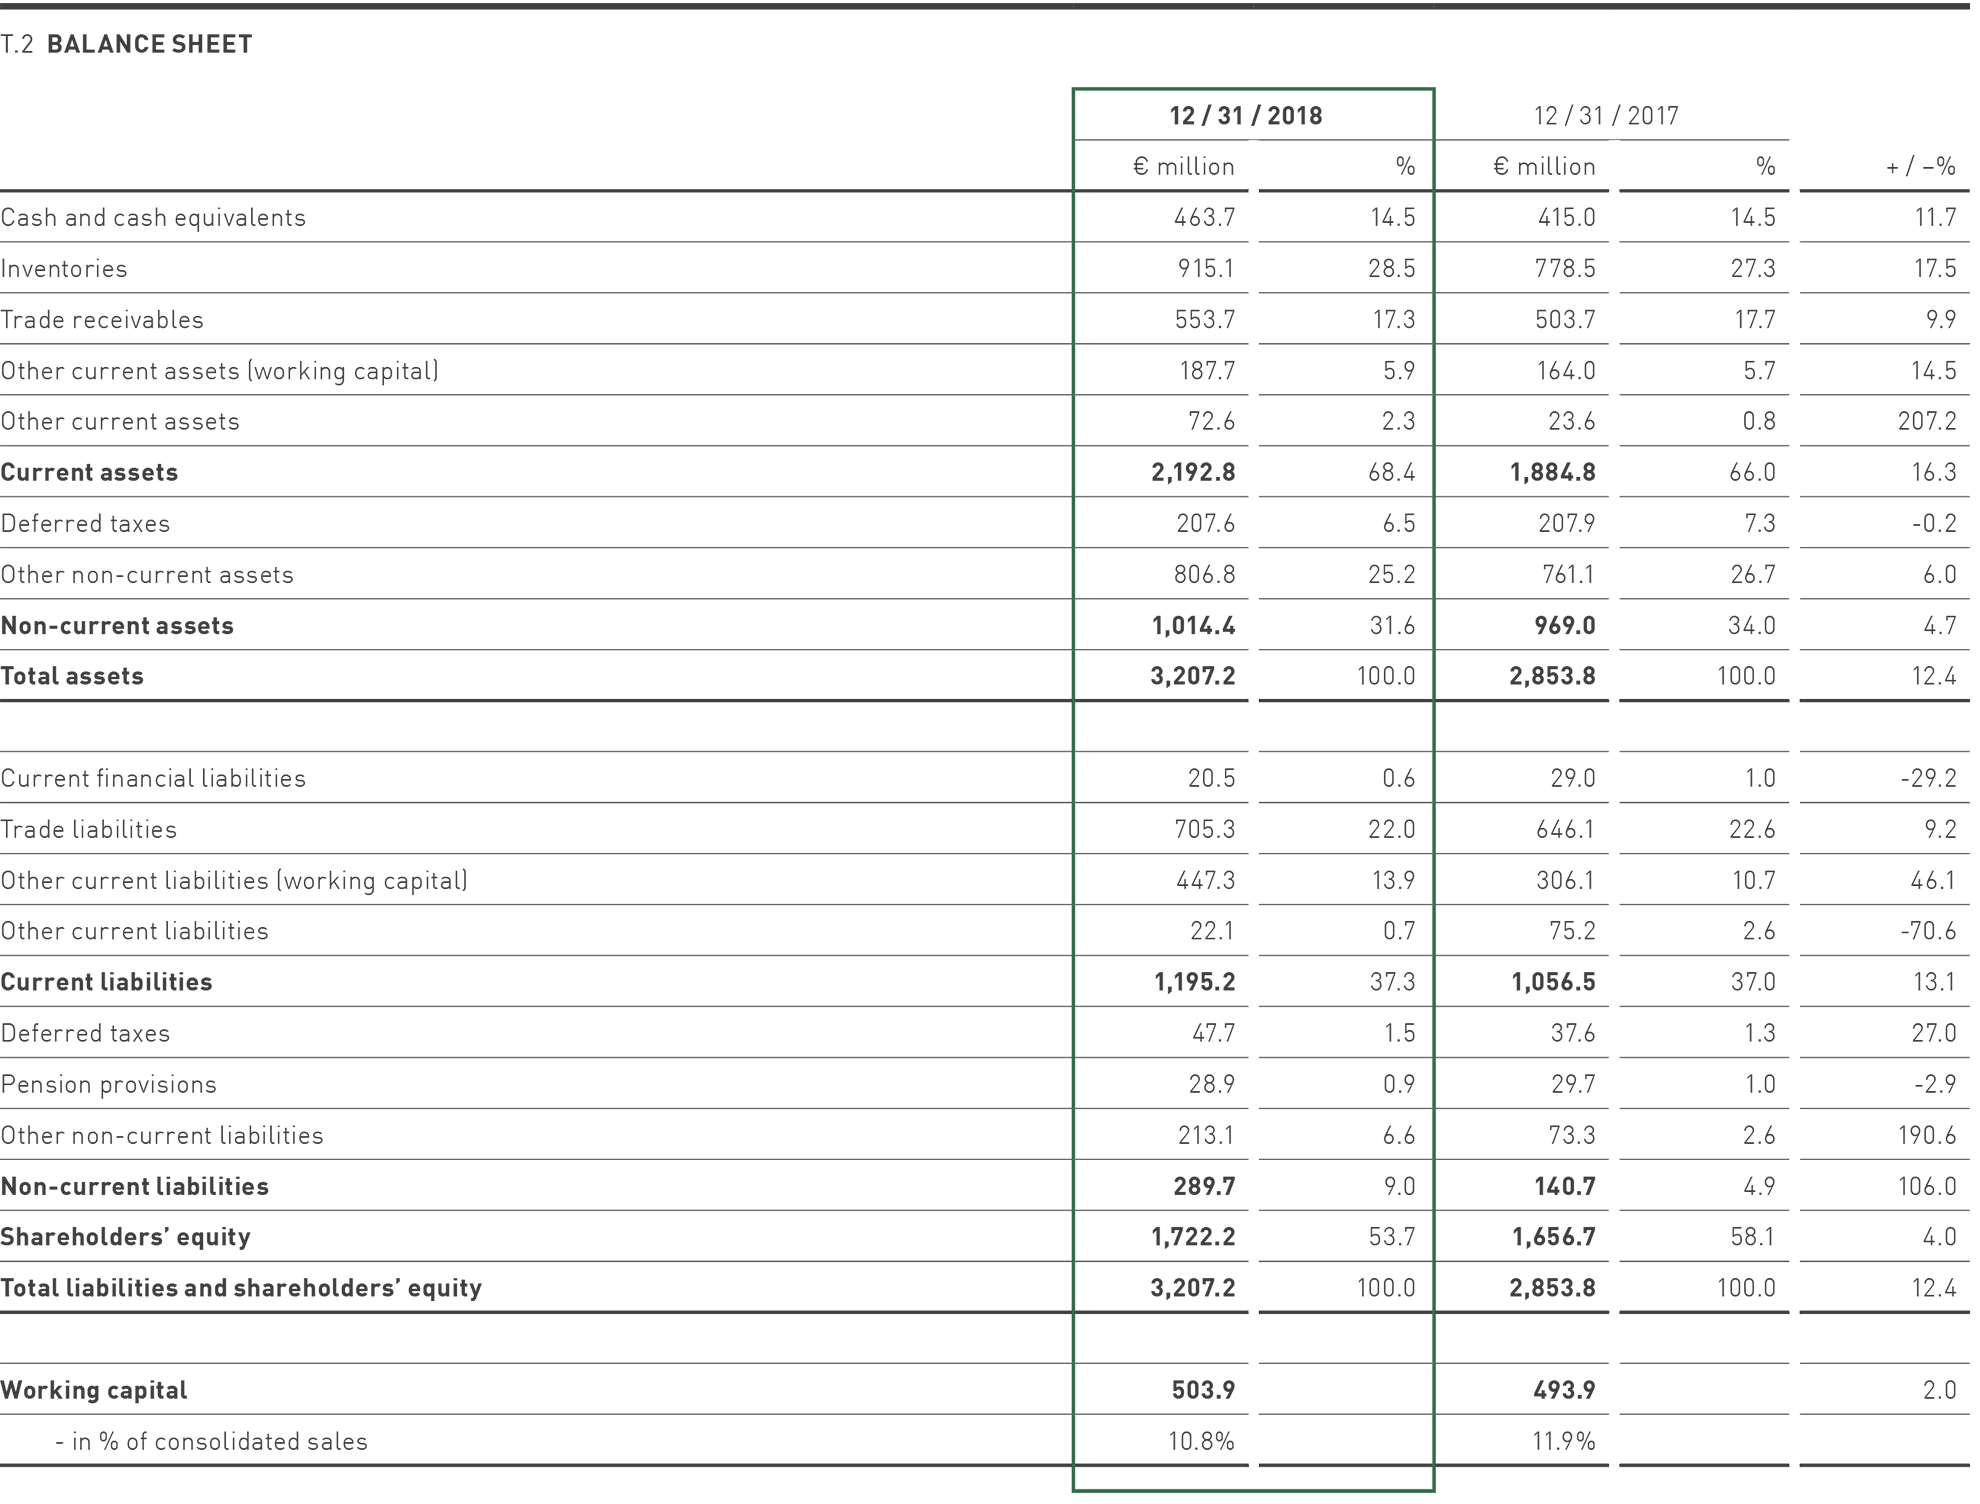
PUMA continues to have an extremely solid capital base. As of December 31, 2018, total assets increased by 12.4% from € 2,853.8 million in the previous year to € 3,207.2 million. As the shareholders’ equity increased by 4.0% from € 1,656.7 million to € 1,722.2 million, there was a mathematical decline in the equity ratio from 58.1% in the previous year to 53.7%, due in particular to the distribution of the special dividend.
Working Capital
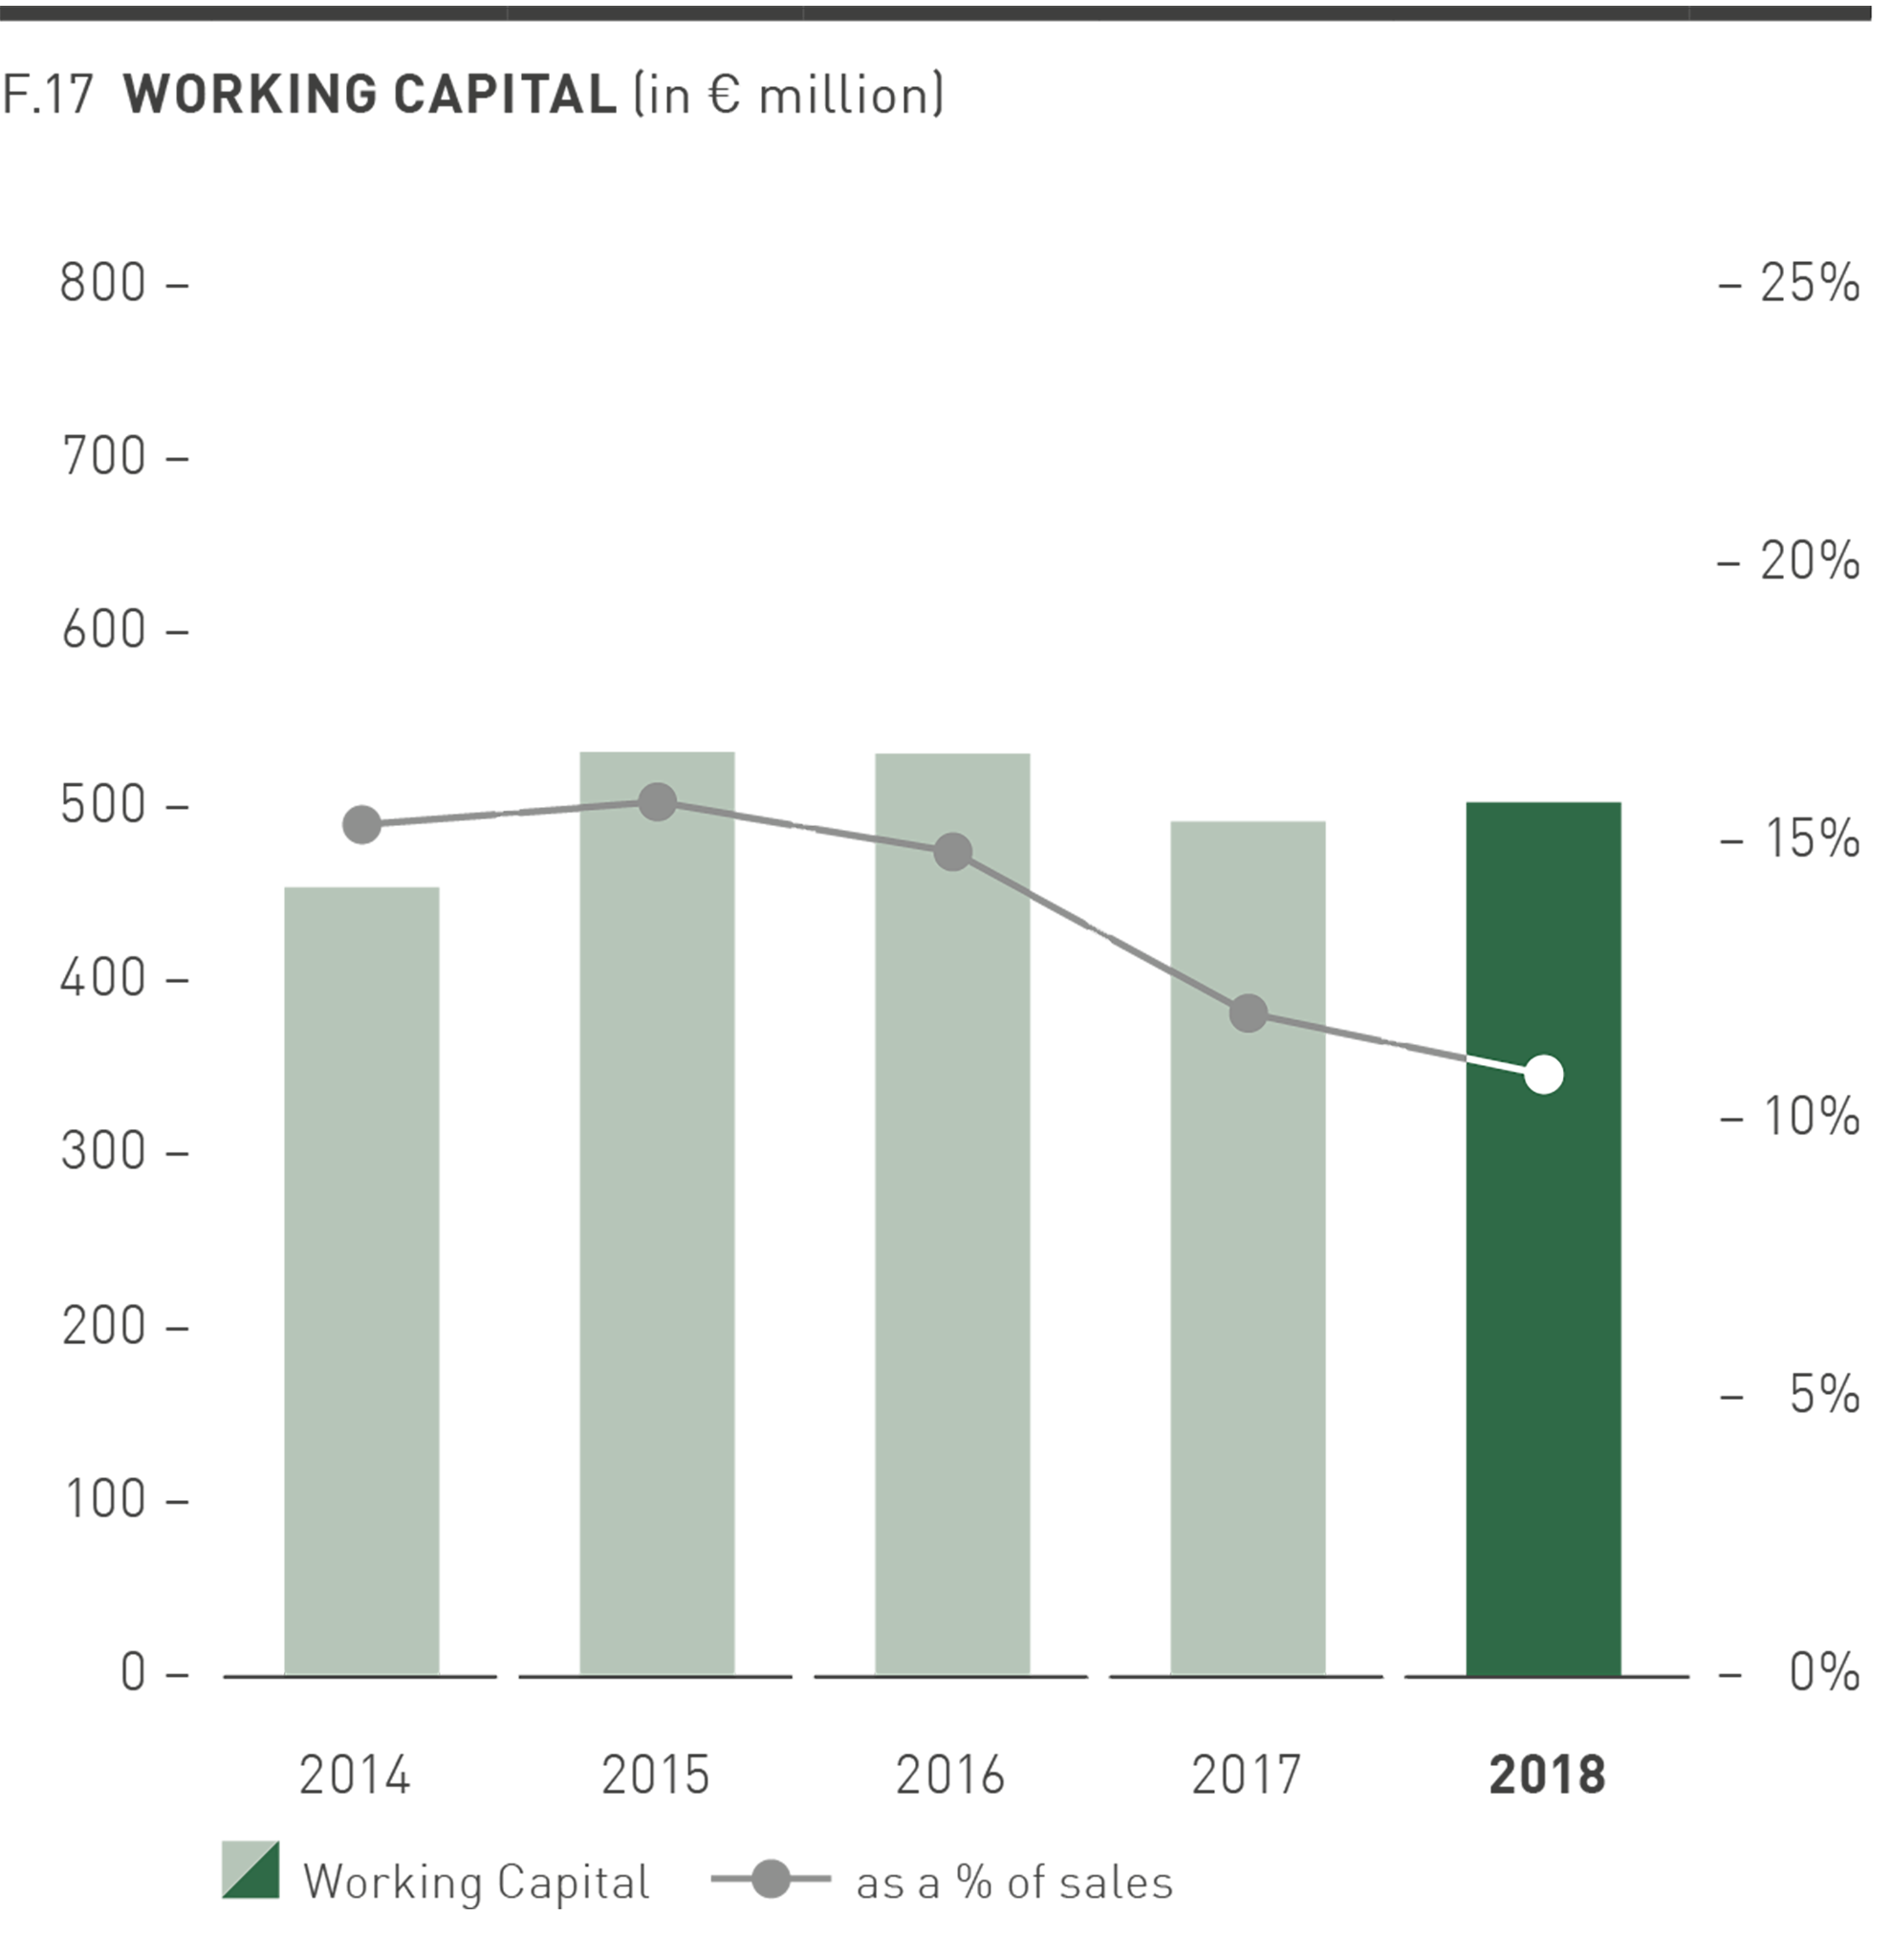
Despite the significant increase in sales and the increased number of our own retail stores, working capital rose only slightly in the past financial year by 2.0% from € 493.9 million to € 503.9 million.
Inventories increased by 17.5% from € 778.5 million to € 915.1 million. This increase is related to the planned sales growth from the 2019 spring / summer collection. In addition, the change in the presentation of expected returns in the balance sheet due to IFRS 15 led to an extension of the balance sheet total and an increase in inventories and other current liabilities. Trade receivables increased by 9.9% from € 503.7 million to € 553.7 million. Other current assets included in working capital increased by 14.5% from € 164.0 million to € 187.7 million.
On the liabilities side, trade liabilities increased by 9.2% from € 646.1 million to € 705.3 million. Other current liabilities included in working capital increased significantly due to the balance sheet extension (IFRS 15) by 46.1% from € 306.1 million to € 447.3 million.
Other Assets and Other Liabilities
Other current assets, which include the positive market value of derivative financial instruments, increased compared to the previous year from € 23.6 million to € 72.6 million.
Other non-current assets, which mainly comprises intangible assets and property, plant and equipment, rose as a consequence of the investments in non-current assets by 6.0% from € 761.1 million to € 806.8 million.
Other current liabilities, which include the negative market value of derivative financial instruments, decreased compared to the previous year from € 75.2 million to € 22.1 million.
Pension provisions remained almost stable compared to the previous year at € 28.9 million (previous year: € 29.7 million).
Other non-current liabilities increased from € 73.3 million in the previous year to € 213.1 million, mainly due to the issue of promissory note loans totaling € 160.0 million.
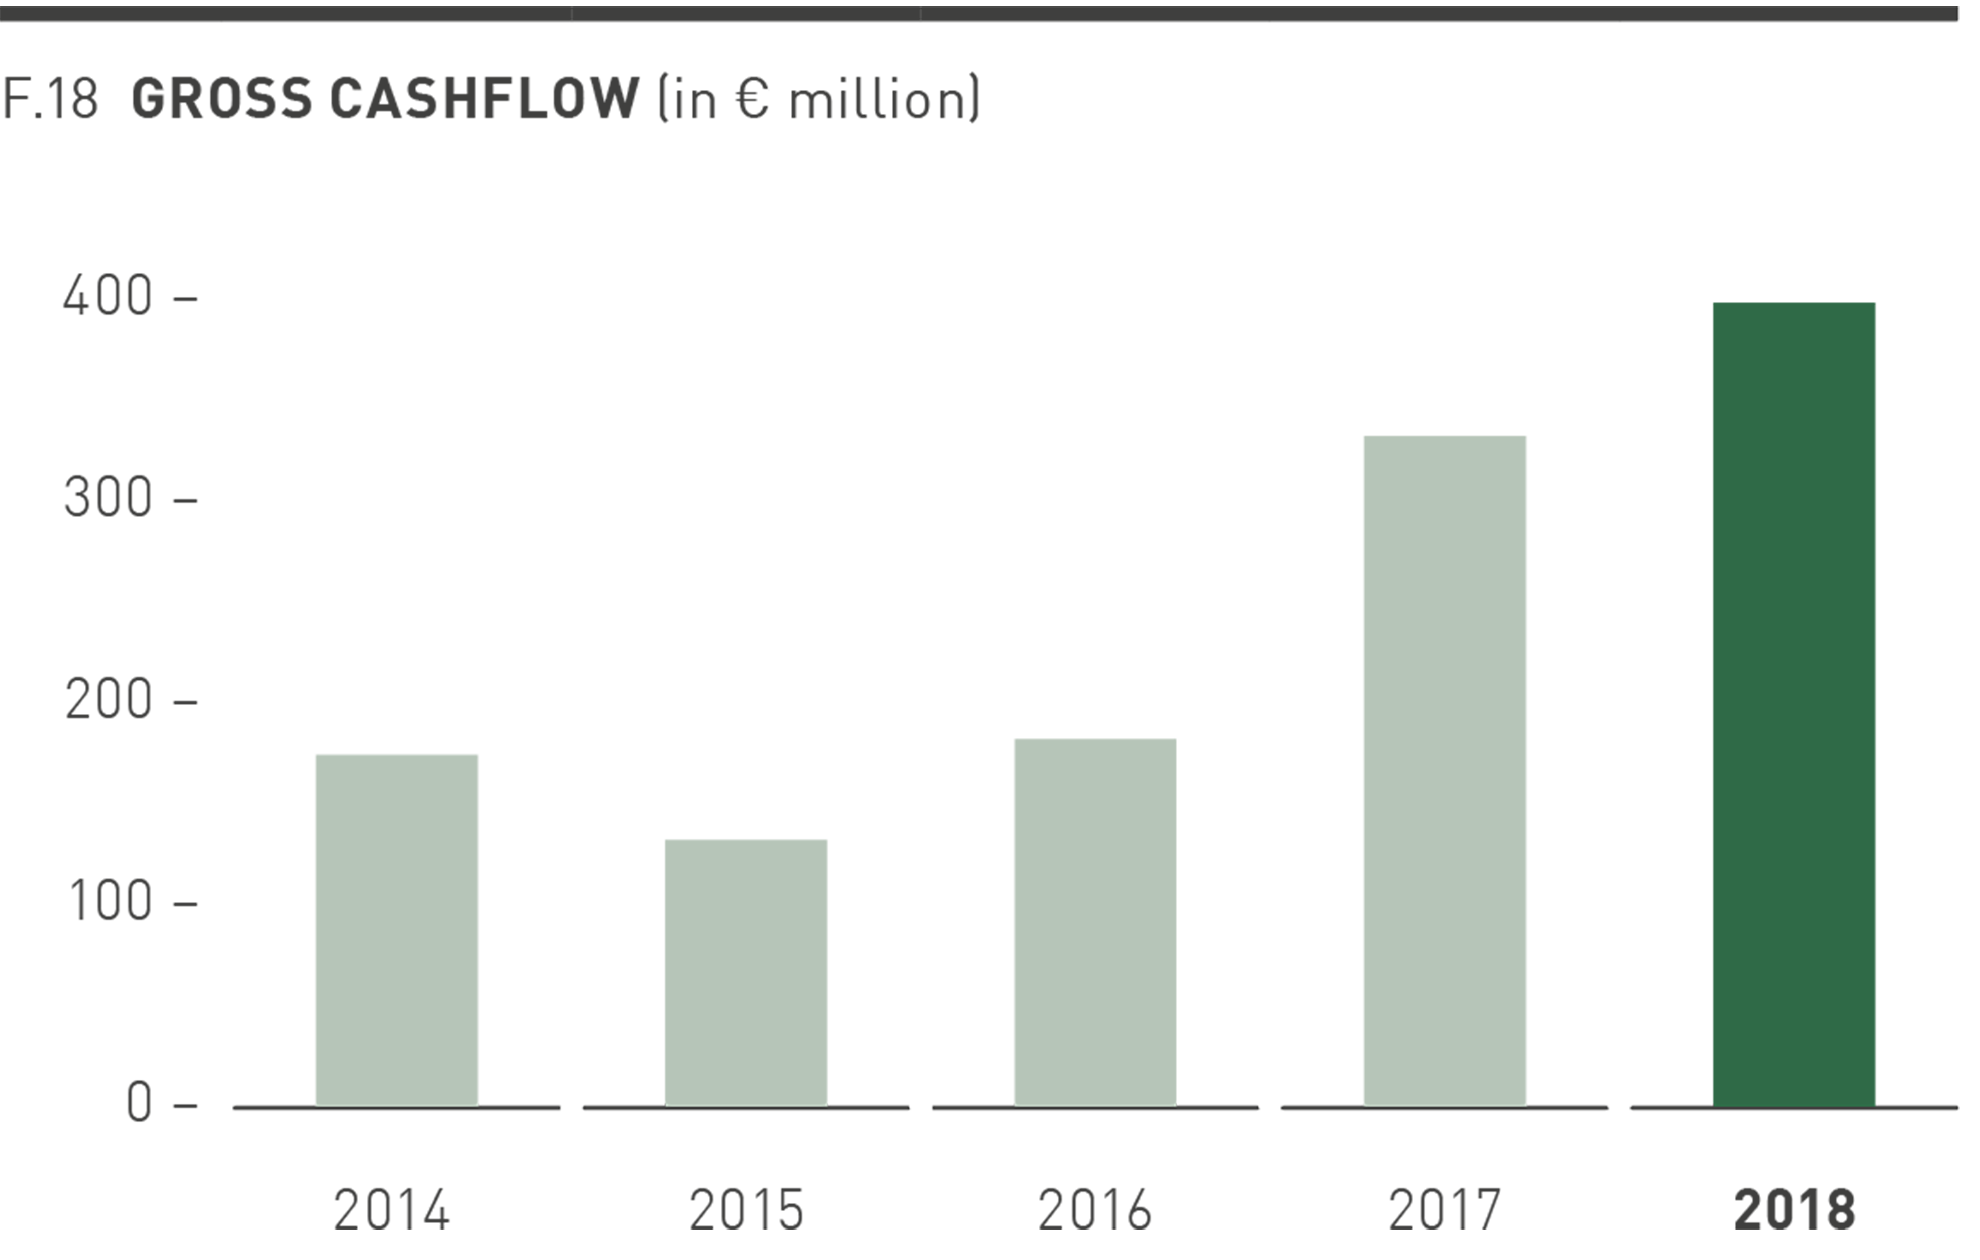
The increase in earnings before taxes (EBT) in the financial year 2018 led to an increase in gross cash flow by 20.3% from € 330.9 million to € 398.0 million. The financial result and the non-cash effected expenses and income, which include in particular the depreciation on property, plant and equipment, were € 84.7 million in 2018.
The continuing strong focus on working capital management significantly contributed to the improvement of the cash flow from operating activities. Net cash from operating activities increased from € 238.8 million in the previous year to € 278.1 million. This resulted from the decline in net current assets* in addition to the increased earnings before tax in 2018. By contrast, the cash outflow from tax payments and dividends received increased to € 81.9 million.
Cash outflow from investing activities in the year under review fell slightly from € 110.3 million to € 105.3 million. The investment in non-current assets included in this figure rose in 2018 from € 122.9 million in the previous year to € 130.2 million and represented primarily investments in own retail stores, IT infrastructure, distribution centers and the completion of the new administration building in Herzogenaurach. The other cash inflows of € 24.9 million (previous year: € 12.7 million) relate in particular to cash inflows from the sale of shareholdings and cash inflows from asset disposals.
* Net working capital includes normal working capital line items plus current assets and liabilities which are not normally part of the working capital calculation.
The free cash flow before acquisitions is the balance of the cash inflows and outflows from operating and investing activities. In addition, an adjustment is made for cash inflows and outflows that relate to shareholdings. The increase of earnings before tax in 2018 was the main driver for the improvement of free cash flow before acquisitions by 16.3% from € 128.5 million to € 149.4 million. As a percentage of sales, the free cash flow before acquisitions was 3.2% compared to 3.1% in the previous year.
Cash flow from financing activities for the financial year 2018 was attributable to the payment of a one-time dividend of € 186.8 million to shareholders of PUMA SE and dividend payments of € 55.7 million to non-controlling interests. On the other hand, net cash inflows from taking up financial liabilities amounted to € 126.8 million. Taking into account interest payments, the cash outflow from financing activities amounted to € 128.3 million (previous year: cash outflow of € 34.9 million).
As of December 31, 2018, PUMA had cash and cash equivalents of € 463.7 million, an increase in cash and cash equivalents of 11.7% compared to the previous year (€ 415.0 million). The PUMA Group also had credit facilities totaling € 691.9 million as of December 31, 2018 (previous year: € 497.1 million). Unutilized credit lines totaled € 501.0 million on the reporting date, compared to € 440.2 million in the previous year.
Statement regarding the Business Development and the Overall Situation of the Group
Overall, the management is very satisfied with the course of business and the economic development in the past financial year. In 2018, PUMA was able to fully meet or even slightly exceed its financial targets, which had already been raised during the year. We owe this in particular to our ability to react quickly and flexibly to changes in our dynamic business environment. For example, volatile exchange rates, the strength of the Euro against a large number of major currencies, and the trade conflict between China and the United States of America led to uncertainties in the trading environment. In addition, major changes in product trends and consumer demand, particularly in footwear, have necessitated a quick response to these changes. We are of the opinion that PUMA managed these challenges very well in the past financial year thanks to our “fast attitude”. The success of our measures is also reflected in the business results of the past year. We see this as further confirmation that we are on the right track with the consistent implementation of the FOREVER FASTER corporate strategy.
PUMA was again able to record strong sales growth in the past financial year with a currency-adjusted increase in sales of 17.6%. This meant that sales of our products in our own retail stores and at our wholesale customers continued to improve. In our opinion, this is primarily due to the increase in our brand heat and the competitiveness of our product range. In 2018, we were also once again able to make significant improvements in terms of profitability, with the operating result (EBIT), net earnings and earnings per share increasing by around 38% compared to the previous year. In addition to the strong sales growth, this is primarily due to the improvement in the gross profit margin and also to the decrease in cost ratio of other operating expenses. At € 337.4 million, the operating result in the past financial year was even slightly above our forecast of € 325 million to € 335 million, which had been raised during the year. Earnings per share rose significantly compared to the previous year from € 9.09 to € 12.54. We thus fully achieved our profitability targets in the past financial year and even slightly exceeded them.
With regard to the consolidated balance sheet, we believe that PUMA continues to have an extremely solid capital base. At the balance sheet date, the equity of the PUMA Group was more than € 1.7 billion and the shareholders’ equity ratio was just under 54%. Furthermore, the consistent focus on working capital management contributed to the fact that working capital increased by only 2% compared to the previous year despite the significant increase in sales.
The increase in earnings before taxes (EBT) and the continued strong focus on the working capital management in the past financial year also contributed to a significant improvement in cash flow. The free cash flow before acquisitions compared to the same period last year increased by 16.3% to € 149.4 million. Cash and cash equivalents amounted to € 463.7 million on the balance sheet date (previous year: € 415.0 million).
As a result, the PUMA group is characterized by an overall solid asset, financial and income situation at the time the combined management report was prepared. This enables the Management Board and the Supervisory Board to propose a dividend of € 3.50 per share for the financial year 2018 to the Annual General Meeting on April 18, 2019. In accordance with the dividend policy, this corresponds to a payout ratio of 27.9% of the net earnings.


