Existing science-based CO2 emission target:
During the UN Climate Conference in Paris in 2015, PUMA agreed to set a science-based CO2 emissions target. In 2018 PUMA co-founded the Fashion Industry Charter for Climate Action, an industry-wide coalition which aims to align the fashion industry’s emissions with the targets included in the Paris Agreement.
One year later, PUMA agreed and published its science-based emission target (SBT) with the SBT Coalition and joined the Fashion Pact, which also includes a climate action commitment.
During 2022 we revised our existing science-based greenhouse gas reduction target and aligned the target with a 1.5-degree scenario. We also published a net zero target for 2050 and added a 100% renewable electricity target to our SBT proposal since we already committed to net zero GHG emissions and 100% renewable electricity as part of our Fashion Industry Charter for Climate Action engagement. Our updated science-based target was developed in 2022 and formally submitted to the SBT Coalition in January 2023.
Old, approved science-based target (well below 2 degrees):
Sports company PUMA commits to reduce absolute Scope 1 and 2 GHG emissions 35% by 2030 from a 2017 baseline year. PUMA also commits to reduce Scope 3 GHG emissions from purchased goods and services 60% per million-euro sales by 2030 from a 2017 baseline year.
New, submitted science-based target (1.5 degrees):
Sports company PUMA commits to reduce absolute Scope 1 and Scope 2 GHG emissions 90% by 2030 from a 2017 baseline year. PUMA also commits to reduce absolute Scope 3 GHG emissions from purchased goods and services and upstream transportation 33% by 2030 from a 2017 baseline year*. PUMA SE commits to continue annually sourcing 100% renewable electricity for its own operations through 2030.
*The target boundary includes land-related emissions and removals from bioenergy feedstocks
The Carbon Disclosure Project (CDP) is an investor-led coalition that ranks global companies and cities for their climate strategies and disclosure. PUMA has been a long-term participant in the CDP, and we make our answers to the CDP questionnaire publicly available via the CDP website. In 2022, for the first time in PUMA’s history, we received an A score for our climate disclosure with CDP for the reporting year 2021.
PUMA’s rating is better than the average performance of the sector (textile and fabric goods) with an average rating of B. The overall global average rating stands at C.
In 2022 we made significant improvements in value chain engagement, Scope 3 emissions, risk management processes and risk disclosure, leading to the highest possible rating of A. During 2021 our score increased compared with 2020 as a result of a host of initiatives taken, including facilitating climate training programs for our suppliers, the participation of our suppliers in industry-wide resource efficiency and renewable energy programs, participation in Higg FEM, the recalculation of Scope 3 emissions, in line with the greenhouse gas protocol, a 12% reduction in absolute Scope 3 emissions from purchased goods and services, life cycle assessments (LCA) of our products, the preparation of a climate roadmap for 2030 and a risk assessment.
The Taskforce for Climate Related Financial Disclosures (TCFD) is an international financial initiative, aiming at more transparency between companies and investors on climate related topics. Since the Carbon Disclosure questionnaire is aligned with the recommendations of TCFD, PUMA, with its A CDP rating, also reports on TCFD principles through its public answer to CDP. Further information on TCFD is given below.
For more information, please visit the PUMA sustainability website or the CDP website.
In 2021 we developed a climate roadmap and conducted a risk assessment using our risk assessment methodology. We see a regulatory landscape with unfavorable policies for renewables in some countries as a high risk. Furthermore, unstable business in our industry overall can restrain suppliers from investing in technologies and upgrading their facilities with low carbon machinery.
Below are key focus areas for the coming years. Some actions were taken in 2021 and continued in 2022and are reported in this report.
*The two LCA results are reported under the Product section of this report.
Climate change has been a focus area for PUMA since the publication of the first Environmental Profit and Loss Account in 2011. As a long-term and A-ranked respondent of the investor-led CDP questionnaire and a founding member of the UN Fashion Industry Charter for Climate Action, PUMA has shown its commitment to combat climate change. Subsequently, we recognize the importance of disclosing climate-related risks and opportunities in line with the recommendations of the TCFD.
The success of our business over the long term will depend on the social and environmental sustainability of our operations, the resilience of our supply chain and our ability to manage the potential impact of climate change on our business model and performance.
Through the implementation of the recommendations set by the TCFD, we summarize the actions PUMA has taken to review its key climate-related risks and opportunities, and the potential impacts on its business and strategy.
The PUMA Board of Management takes overall accountability for the management of all risks and opportunities, including climate change. PUMA’s CEO is responsible for the overall oversight of the group’s strategy, including the sustainability strategy. This includes climate-related targets as stated in PUMA’s 10FOR25 sustainability targets. Besides the oversight of the CEO, PUMA’s Chief Sourcing Officer (CSO) oversees all sustainability-related topics at PUMA, including climate change, at the management board level. Responsibilities of the CSO include approving new climate-related targets, strategies and initiatives. Sustainability falls into the scope of the CSO because the vast majority of the environmental impact of PUMA’s activity is generated during the manufacturing of our products, which are sourced from independent third-party vendors. Therefore, to reduce our climate impact, our sustainability strategy needs to be driven through our supply chain into our vendors’ factories and into the components we reference. The responsibility for these two activities is with the CSO.
The supervisory board sustainability committee is handling sustainability on a supervisory board level. The management board receives updates on sustainability-related matters quarterly, including those related to climate change. The CSO has a monthly meeting with the sustainability leads for corporate and supply chain sustainability in which climate and all other sustainability-related topics are governed. The executive sustainability committee meets twice a year to discuss and govern cross-functional sustainability-related topics, for example, the sustainability bonus targets. It is comprised of all functional heads of the company, such as the global directors for retail, logistics, legal affairs, etc. Sustainability on a product level is governed in a cross-functional business units call, where updates on PUMA’s more sustainable product strategy are shared and discussed monthly. To engage with PUMA’s worldwide subsidiaries on climate change and other sustainability-related topics, the corporate sustainability department organizes a quarterly call in which the nominated sustainability leads for each PUMA subsidiary take part.
All PUMA leaders globally – from CEO to Team Head level – have clearly defined sustainability targets as part of their annual performance bonus. These targets are aligned with PUMA’s Forever Better Sustainability Strategy and focus on our 10FOR25 target areas, including climate change. Climate-related bonus targets include the sourcing of 100% renewable electricity as well as an annual reduction in air freight by 5% from a 2019 baseline. The targets cover 5% of the overall bonus, with climate-related targets accounting for 1.25%.
Our sustainability governance structure is referenced in Sustainability Organization and Governance Structure section.
PUMA has analyzed risks and opportunities related to climate change for over 10 years and identified climate change as a material risk to PUMA during its last materiality analysis conducted in 2018. It has the potential to impact PUMA’s business in the short (0-2 years), medium (2-5 years) and long term (5-10 years). The climate-related risks can be grouped into physical risks and transitional risks. Physical risks for PUMA include extreme weather events, such as flooding or heatwaves, or water scarcity, which can have an influence on raw material availability. Transitional risks include all risks related to the transition to a low-carbon economy, such as changing consumer preferences, policies and regulations, such as carbon taxes or rising energy prices.
The process for assessing, identifying and managing climate-related risks is the same for all principal risks and is described in the Risk Management section. All risks are monitored and reported regularly throughout the year by the risk owners, who are the managers of the functional areas and the managing directors of the subsidiaries. The risk owners are also responsible for the operational management of the identified risks. For example, climate risks in relation to manufacturing in the supply chain are managed by PUMA’s supply chain sustainability team.
To identify the impact of potential climate-related risks, a scenario-based analysis of climate-related risks was commenced in 2022 (see G.16). The analysis is in line with TCFD recommendations by taking into consideration two different climate-related scenarios: First, to analyze transitional risks, the Net Zero Emissions by 2050 Scenario (NZE) developed by the IEA was considered. This scenario represents the development of a low-carbon economy in line with global warming of 2°C or lower. It was also used to develop our 1.5°C aligned science-based target, which was submitted at the beginning of 2023. Second, the impact of physical risks was assessed using the SSP2 – RCP4.5 scenario. This scenario relies on the Representative Concentration Pathways (RCPs) and Shared Socioeconomic Pathways (SSPs) published by the IPCC and reflects the development of greenhouse gas emissions under current government policies, resulting in warming of about 2.7°C by 2100 (per Climate Action Tracker). The different risk categories shown in G.16 are taken from our CDP 2022 response.
Climate-related risks and opportunities have influenced PUMA’s strategy in multiple areas. The demand for more sustainable products has influenced our product portfolio and sourcing practices to shift towards recycled and/or certified materials. On the supply chain side, PUMA invests in supplier programs focused on energy efficiency and renewable energy to reduce the carbon footprint of its manufacturing process. PUMA investigates and invests further in more sustainable material options, such as biodegradable or recyclable materials. Additionally, PUMA operates its ‘Circular Lab’, under which it collaborates with innovation partners on different pilot projects, such as a garment-to-garment recycling process and a biodegradable shoe. Within its own operations, PUMA reduces its carbon footprint by sourcing 100% renewable electricity since 2020 and by gradually shifting its car fleet to low- and zero-emissions vehicles.
Climate-related issues also had an impact on PUMA’s financial planning. Direct costs have been influenced by ESG-linked supplier financing programs that have been in place since 2016. The program provides access for PUMA suppliers to external financing resources with favorable financing conditions. Additionally, as part of the EU Taxonomy Regulations, PUMA is required to report on capital expenditures that lead to greenhouse gas reductions. PUMA’s sales are currently not eligible under the EU Taxonomy Regulation due to the nature of PUMA business (sale of footwear and apparel). In 2022 PUMA identified investments in zero-emissions vehicles and infrastructure such as charging stations to be aligned with taxonomy criteria. The overall taxonomy-aligned investment amounts to EUR 372,460. Further information on EU Taxonomy can be found in the Reporting in Accordance with the EU Taxonomy Regulation section. Sustainability also influences PUMA’s access to capital as it becomes an increasingly important topic for attracting equity and investors. In 2022 PUMA received an AAA rating from MSCI for its sustainability efforts and is listed in the FTSE4Good Index. Our investor relations and sustainability teams are in an ongoing dialog with investors on ESG topics. PUMA maintains a revolving credit facility and one promissory note, which are both linked to the achievements of five ESG targets as defined within our 10FOR25 ESG framework. The targets relate to the sourcing of renewable electricity (climate), sourcing of materials from certified sources (biodiversity), reduction of water consumption at core suppliers (water and air), elimination of plastic bags in stores (plastics and the oceans) and community engagement (human rights).
The results of our scenario analysis are used to ensure the necessary mitigating controls are in place, support PUMA’s risk management activities and inform future business strategies. We will update our scenario modelling as more climate data becomes available and reframe the risks and opportunities to PUMA presented by climate change on a regular basis.
PUMA has been measuring and reporting environmental key indicators of its own operations and its T1 and T2 suppliers for many years, including energy consumption, carbon emissions, water consumption and waste management. These are part of the sustainability section of its annual report, which is published annually and reviewed by a third party.
PUMA aligns its reporting on climate-related metrics for recognized standards, including the GHG Protocol. In addition, our 10FOR25 sustainability targets include absolute carbon reductions, renewable energy procurement and manufacturing of more sustainable products. Further information on our environmental KPIs can be found in the Environmental Key Performance Data section.
Sourcing 100% renewable electricity for all PUMA entities from 2020 is one of the milestones of PUMA’s climate change mitigation efforts. For its suppliers, PUMA has a target of sourcing 25% renewable energy by 2025 (2022: 11%). At the beginning of 2023 we submitted our updated near-term SBTs: Reducing absolute Scope 1 and 2 GHG emissions by 90% (market-based*) by 2030 and reducing absolute Scope 3 GHG emissions by 33% by 2030, both from a 2017 baseline year.
By the end of 2022, PUMA has already reduced its combined Scope 1 and 2 emissions by 86%, and its Scope 3 emissions from purchased goods and services and transportation by 9%. Our efforts in sourcing more sustainable materials led to 99.8% cotton, 100% leather and 70.4% polyester from recycled or certified sources and 7 out of 10 products being more sustainable in line with our internal definition, as well as reduced our GHG emissions from materials by 32%.
As part of the commitment to the UN convened Fashion Industry Charter for Climate Action, and according to PUMA’s Environmental Handbook, PUMA declared its ambitions to meet a net zero 2050 goal. PUMA recognizes that meeting its climate-related targets is dependent on collective action and focus. Improving the market conditions for clean energy supply, such as the rate of installation of renewable electricity in many countries, reducing costs and the availability of purchase power agreements will help shift the rate of decarbonization at scale. PUMA believes it has a role in helping to shape the policy and regulation required and is working collaboratively with partners, suppliers and other organizations to achieve its ambition, including the United Nations Global Compact, the UN Fashion Industry Charter for Climate Action, the Fashion Pact and Stiftung Klimawirtschaft. PUMA also signed a joint letter to the Government of Cambodia asking for support to scale renewable energy in the country.
*A market-based method reflects emissions from electricity that companies have purposefully chosen. It derives emission factors from contractual instruments, which include any type of contract between two parties for the sale and purchase of energy bundled with attributes about the energy generation, or for unbundled attribute claims.
Our own direct CO2 emissions (Scope 1) are mainly caused by emissions from our PUMA car fleet and airplane, as well as emissions from the heating of buildings.
We tackle the emissions from our car fleet by gradually transitioning to zero-emission vehicles in those countries where the charging infrastructure is mature enough to support the transition.
Starting in 2023 we will only allow electric vehicles as new additions to our car fleet in the region of Germany, Austria and Switzerland, which includes our Headquarters and 232 cars.
At the end of 2022, 191 out of 719 cars globally were already battery electric or hydrogen fuel cell cars.
We also significantly expanded the charging infrastructure at our headquarters and selected other offices and now have over 50 charging stations in operation, including 12 public charging stations at our headquarter stores that can be used by employees, business partners and customers free of charge.
For the heating of buildings, we use natural gas in 10% of buildings globally and plan to transition these buildings to biogas or other renewable heat sources over time. Many PUMA buildings globally already use (renewable) electricity for heating.
Overall we were able to reduce our Scope 1 GHG emissions by 19% between 2017 and 2022, and plan to reduce these emissions further by 2025.
PUMA’s indirect GHG emissions (Scope 2) are caused by the electricity used for running our offices, stores and warehouses, including the charging of electric cars, as well as thermal energy used from district heating.
Since 2020, we have already moved all our offices, stores and warehouses to renewable electricity via green electricity tariffs or renewable energy attribute certificates. This has led to a significant reduction of our Scope 2 emissions (market-based). In addition, the closure of our stores in Russia, which were mostly heated by district heating, contributed further to the reduction of Scope 2 emissions. At our headquarters, which is by far the largest consumer of district heat among all PUMA entities, the district heat is created in co-generation with electricity and by using over 50% biogas. In total, we were able to reduce our Scope 2 emissions since 2017 by 98% (market-based).
Further actions to reduce PUMA’s own greenhouse gas emissions include the use of energy-efficient heat pumps at our headquarters, frequent energy efficiency audits at our stores, a free public transport ticket for employees, job-bike-leasing, a meat-free Monday at canteens and tree-planting exercises as part of our community engagement program.
| CO2 emissions1-4 (absolute figures) | 2022 | 2021 | 2020 | 2019 | 2018 | 2017 | % change 2021/2022 | % change 2017/2022 |
|---|---|---|---|---|---|---|---|---|
| Scope 1 – direct CO2 emissions fossil fuels | 6,206 | 4,456 | 4,179 | 6,326 | 6,918 | 7,678 | 39% | -19% |
| Vehicle fleet | 2,264 | 2,008 | 1,985 | 3,618 | 4,073 | 4,134 | 13% | -45% |
| Heating | 1,536 | 2,039 | 2,194 | 2,708 | 2,845 | 3,545 | -25% | -57% |
| Airplane* | 2,405 | 410 | 689 | 2,359 | 1,156 | 487% | - | |
| Scope 2 – indirect CO2 emissions (location-based**) | 35,528 | 32,545 | 29,839 | 40,986 | 43,366 | 40,029 | 9% | -11% |
| Scope 2 – indirect CO2 emissions (market-based***) | 643 | 1,458 | 1,078 | 11,533 | 22,128 | 40,029 | -56% | -98% |
| Electricity (location-based) | 34,885 | 31,087 | 28,761 | 39,282 | 42,145 | 38,914 | 12% | -10% |
| Electricity (market-based) | 0 | 0 | 0 | 9,828 | 20,907 | 38,914 | - | -100% |
| District heating | 643 | 1,458 | 1,078 | 1,705 | 1,221 | 1,115 | -56% | -42% |
| Total Scope 1 and 2 (location-based) | 41,734 | 37,001 | 34,018 | 47,312 | 50,284 | 47,707 | 13% | -13% |
| Total Scope 1 and 2 (market-based) | 6,849 | 5,914 | 5,257 | 17,858 | 29,046 | 47,707 | 16% | -86% |
| Scope 1 and 2 relative to sales (t CO2 per € million sales) (location-based) | 4.9 | 5.4 | 6.5 | 8.6 | 10.8 | 11.5 | -9% | -57% |
| Scope 1 and 2 relative to sales (t CO2 per € million sales) (market-based) | 0.8 | 0.8 | 1.0 | 3.2 | 6.2 | 11.5 | -7% | -93% |
* Including renewable energy attribute certificates
| CO2 emissions1-6 (absolute figures) | 2022 | 2021 | 2020 | 2019 | 2018 | 2017 | % change 2021/2022 | % change 2017/2022 |
|---|---|---|---|---|---|---|---|---|
| Scope 3 – indirect CO2e emissions from corporate value chain | 1,430,690 | 1,355,633 | 1,486,324 | 1,762,087 | 1,586,229 | 1,502,162 | 6% | -5% |
| Purchased goods and services – Tier 1 suppliers | 1,278,758 | 1,242,468 | 1,389,335 | 1,631,904 | 1,484,935 | 1,409,265 | 3% | -9% |
| Fuel- and energy-related activities* | 4,220 | 3,700 | 3,463 | 3,712 | 5,569 | 7,433 | 14% | -43% |
| Upstream transportation and distribution | 127,474 | 106,983 | 91,775 | 107,744 | 80,143 | 71,070 | 19% | 79% |
| Inbound | 99,724 | 85,622 | 67,842 | 98,386 | 74,182 | 64,076 | 16% | 56% |
| Outbound** | 27,750 | 21,361 | 23,933 | 9,358 | 5,961 | 6,994 | 30% | 297% |
| Business travel (rail and air) | 9,439 | 2,482 | 1,751 | 18,727 | 15,582 | 14,394 | 280% | -34% |
| Upstream leased assets* | 10,799 | - | - | |||||
| Total Scope 1-3 (market-based) | 1,437,539 | 1,361,547 | 1,491,581 | 1,779,946 | 1,615,275 | 1,549,869 | 6% | -7% |
| Annual sales PUMA (in € million) | 8,465 | 6,805 | 5,234 | 5,502 | 4,648 | 4,136 | 24% | 105% |
| Total Scope 1-3 relative to sales (t CO2e per € million sales) (market-based) | 169.8 | 200.1 | 285.0 | 323.5 | 347.5 | 374.7 | -15% | -55% |
| Total Scope 3 relative to sales (t CO2e per € million sales) | 169.0 | 199.2 | 284.0 | 320.3 | 241.3 | 363.2 | -15% | -53% |
PUMA is determined to reduce its carbon emissions, water usage, waste and air pollution in its offices and in its supply chain. As far as sustainable materials are concerned, PUMA strives to use more sustainable key materials, such as cotton, polyester, leather and cardboard.
The purpose of PUMA’s environmental efforts is to ensure that its suppliers are in full environmental compliance and any negative impact on the environment is reduced. Ultimately, our goal is to achieve a positive environmental impact. We ask all our core suppliers to complete the Facilities Environmental Module developed by the SAC.
As far as climate is concerned, PUMA’s 10FOR25 action plan includes steps such as:
To reduce the emissions from the production of our PUMA goods, we worked with our suppliers on several programs ranging from energy efficiency to installing on-site solar photovoltaic power plants to generate renewable energy.
Supplier Training and Program
In 2021 PUMA joined hands with other brands and key suppliers under the UN led Fashion Industry Charter for Climate Action to develop a standard training program on climate action for apparel and footwear suppliers in Asia, in partnership with GIZ. This online training program provides foundational knowledge to suppliers on global decarbonization efforts, GHG emissions accounting, climate target-setting methodology and solutions to reduce emissions and achieve these targets. The training is available in English and other local languages such as Khmer, Mandarin, Bengali and Vietnamese. We encouraged our suppliers to participate in this self-paced online training course available free of cost.
The online training provides foundational knowledge to suppliers on:
In 2022, 242 participants from 186 supplier factories completed this course and attempted the final exam. 98% of the participants successfully passed the exam and obtained the certificate from GIZ, with an average score of 75.7%.
In 2022 we nominated 568 participants from 18 core factories in Vietnam to join a tutor-assisted training program on GIZ in collaboration with VF Corporation and New Balance. 98% of participants obtained a certificate with an average score of 85% in the final exam.
In 2022 we provided customized climate training for each geographical area with a regional focus. The training programs include topics such as rooftop solar procurement, coal phase-out and purchase of I-RECs. A total of 417 participants from 243 factories participated in these training programs. This training session along with GIZ climate action training courses by our suppliers, helped to accelerate the implementation of rooftop solar projects, increase the purchase of renewable energy attribute certificates, provide higher take-up of feasibility studies for coal-fired boilers and initiate action for coal phase-out. We also saw better participation of our core suppliers in cleaner production and renewable energy projects. The details of the progress in these areas are described in this report.
| Training topic | Country | Trainer | Number of factories | Number of participants |
|---|---|---|---|---|
| Rooftop solar procurement and mitigating associated contractual risks | Vietnam | Act Renewable | 20 | 46 |
| Rooftop solar procurement & legal framework | Cambodia/ Bangladesh/ Indonesia |
Act Renewable | 34 | 64 |
| How to purchase renewable energy | China/Taiwan | Accenture & Envision Energy | 59 | 92 |
| Renewable energy pathway | China/Taiwan | Reset Carbon | 67 | 117 |
| Coal phase-out with biomass transition | Vietnam | Act Renewable | 5 | 10 |
| I-REC virtual workshop | Vietnam/ Cambodia |
Monsoon Carbon | 58 | 88 |
Furthermore, to improve the awareness level of employees, we have developed a foundational e-learning training module for all employees. This module is in the final stage of development and is expected to be rolled out in the first half of 2023.
In 2022 we expanded the participation of our Core Tier 1 and Tier 2 suppliers in cleaner production and renewable energy projects.
For the first time we launched the Clean by Design (CbD) Program in Indonesia and launched phase 2 of clean by design in the Vietnam and China-Taiwan region.
Our suppliers continue to implement the recommendations of the PaCT program in Bangladesh during this year.
In 2022 eight Tier 1 and three Tier 2 factories were enrolled in the Clean by Design Project in Indonesia, Vietnam, China and Taiwan. In addition to this, 12 Tier 1 and 15 Tier 2 factories participated in various rooftop solar projects.
The values below represent annual savings from completed and ongoing projects from 2019 until the end of 2022:
| Country | Program/partner | Scope | Number of factories | % sourcing volume (globally) |
|---|---|---|---|---|
| China-Taiwan | Clean-by-Design(CbD)/aii | Energy and water efficiency | T1:1 T2: 11 |
2022 Tier 1 – 67% Tier 2 – 59% Enrolled in 2023 Tier 1 – 74% Tier 2 – 75% |
| Low Carbon Manufacturing Program (LCMP)/WWF | Energy and water efficiency | T1: 9 | ||
| Bangladesh | Partnership for Cleaner Textile (PaCT)/IFC | Energy and water efficiency | T1: 7 T2: 4 |
|
| Vietnam | Clean-by-Design(CbD)/aii FABRIC/GIZ | Energy and water efficiency, coal phase-out | T1: 8 T2: 3 |
|
| Mekong Sustainable Manufacturing Alliance (MSMA) | Energy and water efficiency | T1: 2 T2: 2 |
||
| Greening Textile Program | Energy and water efficiency | T2: 2 | ||
| Indonesia | Clean-by-Design (CbD)/aii | Energy and water efficiency | T1: 3 | |
| Mexico | Sustainable energy for all | Energy efficiency | T1: 2* | |
| Total | T1: 30 T2: 24 |
| Country | Program/partner | Scope | Number of factories | % sourcing volume (globally) |
|---|---|---|---|---|
| Vietnam | Project Development Program (PDP)/ GIZ | Rooftop solar | T1: 5 T2: 2 |
2022 Tier 1 – 62% Tier 2 – 59% Enrolled in 2023 Tier 1 – 76% Tier 2 – 75% |
| Self-initiative by factories | Rooftop solar | T1: 5 T2: 8 |
||
| Self-initiative by factories | IRIREC/DPPA pilot | T1: 4 T2: 3 |
||
| China-Taiwan | Self-initiative by factories | Rooftop solar | T1: 7 T2: 14 |
|
| Offsite wind, DPPA, I-REC | T1: 3 T2: 9 |
|||
| Bangladesh | Partnership for Cleaner Textile (PaCT)/IFC | Rooftop solar | T1: 2 T2: 3 |
|
| Self-initiative by factories | Rooftop solar | T1: 3 T2: 2 |
||
| Project Development Program (PDP)/ GIZ | Rooftop solar | T1: 4 | ||
| Indonesia | Clean-by-Design(CbD)/aii | Rooftop solar | T1: 3 | |
| Pakistan | Project Development Program (PDP)/ GIZ | Rooftop solar | T1: 2 | |
| Total | T1: 38 T2: 42 |
We are committed to phasing out coal-fired boilers from our supply chain, mainly from the core Tier 1 and Tier 2 suppliers, by 2025. In 2022 we mapped our core suppliers and found that 21 of them have coal-fired boilers.
Out of these 21 factories with coal-fired boilers, 15 have already completed feasibility studies to identify suitable alternatives, while four factories are conducting such feasibility studies. Out of these 21 factories, 13 factories have started to partially replace coal.
In 2022 PUMA joined the Coal Phase Out Action Group under the UN’s Fashion Charter, with an objective to collaborate with other brands to expedite the phase-out of coal in our supply chain. We included a coal-fired boiler question in our on-boarding checklist for new factories in July 2022, to avoid on-boarding new factories with coal-fired boilers.
In 2023 we plan to engage with the remaining six suppliers who have not yet completed the feasibility studies and the remaining eight factories, which have not yet initiated the transition. We also plan to continue tracking factories which are under transition.
Supplier Climate Targets
Science based targets are ambitious and difficult to achieve. Only large suppliers with capacity and top management commitment will be able to succeed. Those suppliers are identified through a readiness survey, climate investment study, long term business potential and in alignment with sourcing leaders. For the remaining suppliers, we plan to implement a simplified target setting system and hence a inhouse tool is developed for these suppliers.
During 2021 we developed two training modules for our core suppliers with the objective of driving climate target setting. One module focuses on the group of suppliers that need to establish science-based targets, and the other is aimed at the group of suppliers that need to establish climate targets based on a simplified tool developed in-house. To identify each group, we conducted a readiness level mapping of core Tier 1 and Tier 2 suppliers with a survey based on the following criteria:
In continuation of efforts made in 2021 to SBT for key suppliers, we conducted a climate investment survey for our top 20 suppliers and evaluated long-term business potential with them in alignment with our sourcing leaders.
We identified 20 supplier groups, which represent 40-50% of our business volume, for which we will conduct a kick-off meeting to initiate the SBT process in Q1 2023. In this meeting we will briefly introduce the steps to be taken and address the queries and concerns of suppliers. Some of the suppliers, who have already started their journey, will share their experience and learnings.
The meeting will be attended by the senior management and sustainability heads of suppliers, PUMA sourcing leaders, and PUMA’s sustainability team.
*Ambitious targets mean those that are in line with Paris agreement scenarios (1.5 degree).
The Shenzhou Group established its science-based carbon emissions reduction targets for its Scope 1 and 2 pursuant to “SBTi Criteria 4.2” in 2021. Therefore, the Worldon factory under Shenzhou in Vietnam started the Roof Top Solar project in June 2022. By October 2022, the Roof Top Solar panels were installed and started operation with full design capacity of 8MWp. The project was implemented in the OPEX module in which the investment is made by a service provider. The renewable electricity generated from the roof top solar system contributes to electricity consumption for the production process at the factory. The total annual renewable electricity generation accounts for 30% of the electricity used at the factory, which leads to greenhouse gas reduction potential of 9,649 tCO2e per annum.
Far Eastern New Century (FENC) Corporation Kuan Yin Dyeing & Finishing Plant in Taiwan has replaced the conventional dyeing machines with 19 sets of low liquor ratio dyeing machines along with installation of a high-efficiency boiler. With a 2.1% decrease in yearly production volume and a 15% increase in grid electricity prices since summer 2022, the dyeing mill has managed to reduce absolute greenhouse gas emissions by 10%, which is approx. 1,800 tCO2e. This is a 29% reduction in greenhouse gas intensity as compared to 2021. Their overall energy cost only increased 4.9%. Apart from the greenhouse gas reduction and cost control they have achieved a significant 11.5% reduction in water consumption as compared to 2021, which is an absolute saving of 54,000 m3 of fresh water. This has resulted in less wastewater and hence less sludge from wastewater treatment plants. As a result of this, the mill has reduced 8% solid waste, which is around 84 tons per year.
Realizing the benefit of cooling water which has a high temperature (50-70 degrees Celsius) and is still good quality, our textile fabric suppliers have reused this water for dyeing and washing processes. For example, a fabric supplier located in Vietnam benefited from this initiative to save energy of 6,200 GJ/year as they require less energy to heat water in the dyeing process. Moreover, this initiative saves 3,800 m3 of fresh water every year and the total financial savings are USD 19,000 per year.
The reduction of our Scope 3 emissions at the factory level is complemented by purchases of more sustainable (less carbon-intensive) raw materials. In 2022 we used 70.4% more sustainable polyester, out of which 48% was recycled polyester, 99.8% more sustainable cotton, mainly from the Better Cotton Initiative (BCI) and 100% leather from Leather Working Group medal-rated tanneries. In addition, 99.4% of our paper and cardboard packaging was recycled or FSC-certified paper. By 2025 we aim to use 75% recycled polyester and 100% recycled and/or certified paper and cardboard.
Carbon Footprint & Energy Use
In 2022, we continued our assessment of Scope 3 emissions that come from PUMA’s indirect business activities, mainly in the supply chain in line with the Greenhouse Gas Protocol by lifecycle expert company, Sphera.
As in 2021, they conducted a comprehensive assessment of our supply chain emissions beyond Tier 1 manufacturing, including Tier 2 manufacturing of fabrics and components, estimated emissions from T3 suppliers and material production using emission factors from their LCA database known as GaBi database.
| Scope 3 emissions (category -1) | 2017 (baseline) | 2021 | 2022 | % change 2017/2021 |
|---|---|---|---|---|
| Absolute GHG emissions (tCO2 eq) | 1,409,265 | 1,242,468 | 1,278,758 | -9% |
Note: Scope 3 category 1 estimation includes GHG emissions associated with goods and services purchased by PUMA from its suppliers related to PUMA products and associated packaging. This excludes emissions associated with other goods and services acquired by PUMA offices, stores and warehouses.
We can see that our absolute scope 3 emissions from the category, purchased goods and services have decreased by 9% from 2017 to 2022, while material consumption has increased by 27% during the same period. Due to energy efficiency improvements and the use of renewable electricity at factory level, as well as the usage of more sustainable materials, our absolute emissions have decreased while our business has grown by 105% as compared to the base year of 2017. Moreover, the initiatives taken by the factories towards the end of 2022 e.g., participation in cleaner production projects, installation of roof top solar etc. will reflect results in coming years. Scope 3, category-1 emissions mainly originate from two sources; the raw materials and the energy consumed by our core Tier 1, Tier 2 and Tier 3 (production of raw material) suppliers to produce finished materials and components as well as finished goods.
Energy coming from renewable sources in the supply chain*
The share of renewable electricity sourcing by Tier 1 and Tier 2 suppliers has increased from 0.35% in 2017 to 16.2% in 2022 which marks a 4569% jump in renewable electricity sourcing. Looking at the Tiers in the value chain the share of renewable electricity has increased from 0.18% in 2017 to 4.9% in 2022 by Tier 1 suppliers, while it has increased from 0.74% to a significant 43.2% for Tier 2 suppliers during the same period including I-RECs.
| Scope 3 emissions (category -1) | 2017 (baseline) | 2021 | 2022 | % change 2021/2022 | % change 2017/2022 |
|---|---|---|---|---|---|
| Total renewable electricity (kWh) | 817,644 | 14,494,042 | 64,624,534 | 346% | 7,804% |
| Total grid electricity (kWh) | 234,323,351 | 324,910,084 | 333,408,508 | 3% | 42% |
| Share of renewable electricity | 0.35% | 4.3% | 16.2% | 280% | 4,569% |
| T-1 renewable electricity (kWh) | 298,283 | 11,149,103 | 13,695,766 | 23% | 4,492% |
| T-1 grid electricity (kWh) | 164,904,224 | 218,804,548 | 266,321,305 | 22% | 62% |
| Share of renewable electricity (T-1) | 0.18% | 4.8% | 4.9% | 1% | 2,609% |
| T-2 renewable electricity (kWh) | 519,361 | 3,344,939 | 50,928,768 | 1,423% | 9,706% |
| T-2 grid electricity (kWh) | 69,419,127 | 106,105,536 | 67,087,203 | -37% | -3% |
| Share of renewable electricity (T-2) | 0.74% | 3.1% | 43.2% | 1,312% | 5,711% |
Note:
The total electricity does not include captive electricity generation from fossil fuels such as natural gas, diesel etc. The renewable energy includes I-REC certificates purchased by core leather, polyurethane, textile factories in 2021, but excludes renewable energy sourced by the Tier 2 core factories, e.g. packaging & labelling, trims, footwear bottom and knitted upper
Carbon footprint in the supply chain**
Looking further into the emissions from our supply chain, we see that absolute GHG emissions from Tier 1 and Tier 2 suppliers have been increasing by 23%.
Absolute GHG emissions from Tier 3 suppliers in 2022 have increased by 21%. A closer look at the data indicates that this increase in absolute emissions from Tier 3 suppliers is mainly due to a rise in the consumption of cotton and polyester during this period. Cotton and polyester together increased by 16% in 2022 as compared to 2017.
We see opportunities to further scale up cleaner production and renewable energy programs to more Tier 1 and Tier 2 suppliers, and also to launch them at some of the spinners (Tier 3).
| 2017 (baseline) | 2021 | 2022 | % change 2021/2022 | % change 2017/2022 | |
|---|---|---|---|---|---|
| Absolute GHG emissions from Tier 1 and Tier 2 suppliers (t CO2e) | 345,361 | 358,508 | 423,762 | 18% | 23% |
| Tier 3 suppliers (t CO2e) | 252,251 | 284,215 | 305,869 | 8% | 21% |
Note:
Tier 1 & Tier 2 emissions are estimated based on actual energy consumption collected from core Tier 1 and Tier 2 factories and extrapolated to cover all Tier 1 and Tier 2 supplier factories.
Tier 3 emissions are estimated by Sphera by using its GaBi database.
Drilling down into product divisions the absolute emissions are reduced by the leather tanneries by 66%.
Note:
T1: Apparel, Footwear & Accessories factories
T2: Leather, textile, polyurethane factories
Carbon footprint at a raw material level
Absolute GHG emissions from raw material consumption were reduced by 32% as the total material consumption itself has increased by 27%. This is achieved due to our continuous endeavour to shift towards more sustainable materials. For example, more sustainable cotton (Better Cotton or recycled) and polyester (recycled, bluesign or OekoText-certified) increased from 40% and 47% respectively in 2017 to 99.8% and 70.4% respectively in 2022.
| 2017 (baseline) | 2021 | 2022 | % change 2021/2022 | % change 2017/2022 | |
|---|---|---|---|---|---|
| Total raw materials (T) | 158,509 | 187,101 | 200,514 | 7% | 27% |
| GHG emission from materials (tCO2e) | 811,654 | 599,849 | 549,127 | -8% | -32% |
Assumptions: During the Scope 3 assessment, it was observed that the material data collection has improved over time and since 2021 we are able to capture the material data comprehensively. For example, for 2017 material data was not available for all types of materials and some material data were incomplete. In the absence of comprehensive raw material data for 2017, material data was extrapolated from 2020. Furthermore, we observed that the polyester consumption data for footwear was exceptionally high for 2020 and possibly erroneously overestimated. Therefore, the polyester data for footwear for 2017 and 2020 was extrapolated from 2019 data.
A breakdown analysis as shown in the chart below indicates that polyurethane (22%) contributes maximum followed by leather (20%) and polyester (18%). The emission share of rubber has significantly reduced from 33% in 2017 to 10% in 2022. The emission share of leather has marginally reduced from 21% to 20%. The analysis for 2022 indicates that we need to focus more on the sustainable alternatives for polyurethane and rubber (92% of the rubber we use is synthetic).
Note:
Other include acrylic, linen, lycra, metals, adhesives, etc.
Leather is natural leather while polyurethane is imitation leather, also known as synthetic leather.
PUMA’s Logistics Team has been working on reducing greenhouse gas emissions from transport of goods for several years. Key measures include the optimization of container loads, as well as reduction of airfreight to an absolute minimum. The airfreight reduction is also part of PUMA’s annual bonus targets. Furthermore, PUMA is a member of the sustainable airfreight alliance.
2022 brought progress in several areas:
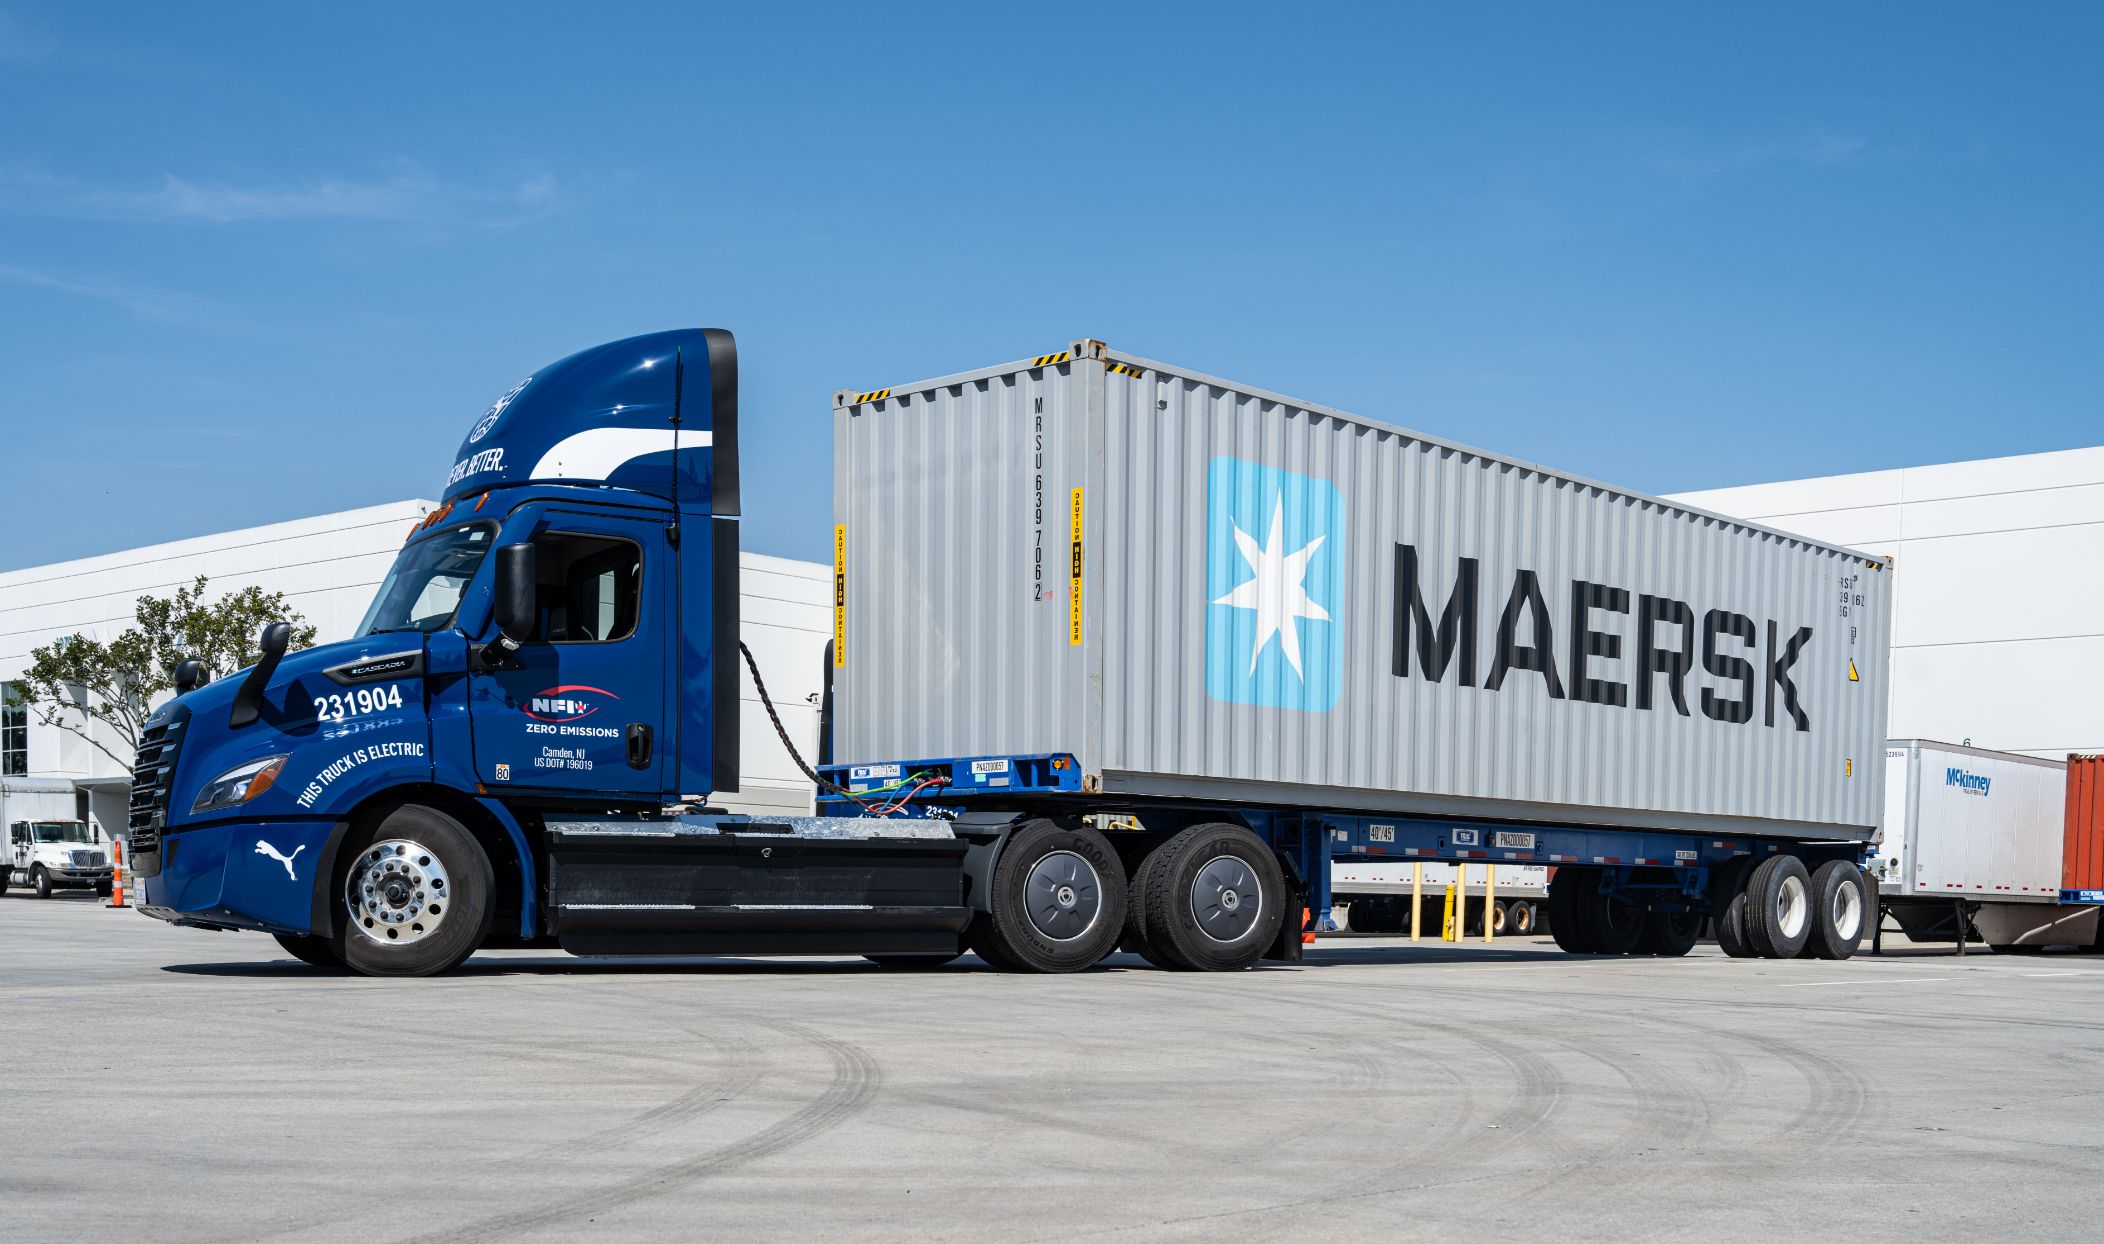
An electric truck operates at PUMA’s warehouse in California, USA
| GHG emissions per transport mode | 2022 | 2021 | 2020 | 2019 |
|---|---|---|---|---|
| Road freight | 48,345 | 38,815 | 30,256 | 24,522 |
| Rail freight | 675 | 3,153 | 1,783 | 1,013 |
| Sea freight | 45,891 | 44,698 | 31,667 | 19,830 |
| Air freight | 29,751 | 17,731 | 17,045 | 58,651 |
The graph and table above illustrate the relative reduction of airfreight compared to other modes of transport. Our airfreight reduction target helped us reduce the share of emissions from airfreight from 56.4% in 2019 to 23.9% in 2022.
“PUMA has been a long-term customer and partner of Maersk for the transport of goods and in the field of sustainability. In 2022, we piloted a first electric truck for the shipment of PUMA goods from port to warehouse in the United States and concluded an agreement to use biofuels starting 2023 for shipping lines from Asia to Europe. We are convinced that the decarbonization pathway plans of the apparel and footwear industry need to include emissions from transport of goods and stand ready to support our customers in tackling this challenge together.”
VINCENT CLERC
CEO, A.P. Moller - Maersk