The purpose of our environmental efforts is to ensure that PUMA and its suppliers are in full environmental compliance and any negative impact on the environment is minimized.
We frequently conduct efficiency audits at our own entities. Compulsory in the European Union, these audits help us identify energy saving opportunities at our offices, stores and warehouses and roll them out on a global basis.
As far as our suppliers are concerned, our PUMA compliance audits (detailed in the Human Rights section) contain a dedicated section on environmental and chemical compliance. For example, during each audit we inspect environmental permits, waste management and effluent treatment plants.
PUMA has moved from individual brand environmental audits to the use of industry-wide tools, such as the Higg Index Facility Environmental Module (FEM) 3.0. PUMA requires an annual external verification of the self-assessment FEM modules. This external verification may be completed by approved verifiers from PUMA’s internal team, other credited brands, or third-party organizations on the approved list from SAC. 100% of verifications are announced.
|
|
2021 |
||
|
|
Core T1 |
Core T2 |
Core L&P* |
|
A |
5 |
3 |
1 |
|
B+ |
21 |
23 |
5 |
|
B- |
27 |
24 |
4 |
|
C |
12 |
17 |
1 |
|
D |
|
2 |
1 |
|
Total |
65 |
69 |
12 |
|
Number of factories |
146 |
||
*L&P: Label and Packaging
PUMA’s Environmental Performance Rating System is based on the ratings developed from the factories’ Higg FEM scores verified by SAC approved verifiers: A, B+, B-, C and D. The minimum passing grade from the environmental perspective is 40% (i.e., only A, B+ and B- ratings are passable) and C and D are failure ratings. This rating system was presented during suppliers and sourcing team meetings in 2020 and will be implemented gradually from 2022. Our environmental handbook has been updated accordingly. This rating system will be included in our vendor supplier scorecard along with social and chemical ratings in the future.
Further data on the environmental performance of PUMA and our suppliers can be found in the Climate and Environmental KPI sections.
*FEM 2020 PUMA average: 146 factories
Industry median FEM (4409 factories): filter used industry sector (Apparel, Footwear, Accessories includes handbags, jewelry, belts and similar products) and Facility Type (Final Product Assembly, Printing, Product Dyeing and Laundering, Material Production including textile, rubber, foam, insulation, pliable materials)
The Higg FEM assesses:
In 2020 and 2021 we communicated to our core factories our expectation to improve their score by 10 points and use our new grading system. In 2021 we facilitated a training session conducted by SAC certified trainers. This training was compulsory to attend for low performance factories and for those not familiar with this industry tool. We then monitored closely to make sure the factories would complete the verification of their self-assessment timely.
We saw the positive impact of cleaner production and renewable energy projects, wastewater treatment training and chemical management training on the scores of factories that joined these programs.
Overall, our core factories have a score above 60% on wastewater, water, energy and environment management system. This has been aligned with our focus and work for many years. The highest score increase was observed in the area of target and improvement plan setting.
We see topics such as chemicals, air and waste as a key focus. In 2021 we conducted a risk assessment for chemicals and waste and identified actions to be taken in the coming years. As a founding signatory of ZDHC, we follow up closely on the development and the progress of ZDHC air emission standards and guidelines and will apply these in the supply chain as applicable, once details are available.
|
Meeting |
Topics |
Number of factories |
Number of participants |
|
Supplier virtual meetings |
Sustainability updates, best practices sharing, etc. |
Approx. 466 per round (3 rounds) |
Approx. 1,083 per round (3 rounds) |
|
Higg FEM training |
For core factories to understand how to complete the Higg FEM module correctly |
103 |
192 |
|
Wastewater training |
For suppliers who were not fully compliant, focus on remediation |
18 |
18 |
|
Enablon eKPI collection training |
For core factories how to correctly fill in the operation data |
105 |
251 |
|
GRS/RCS training |
Guiding suppliers who produce products with recycled content for PUMA on how to apply relevant certificates |
|
278 |
Target description:
Existing science-based CO2 emission target:
Additional 1OFOR25 targets
Relates to United Nations Sustainable Development Goals 7 and 13
Examples of the 10FOR25 action plan:
KPIs:
*The GHG Protocol Corporate Standard classifies a company's GHG emissions into three “scopes" as below.
Scope 1: Direct GHG emissions occur from sources that are owned or controlled by the company (offices, stores, warehouses) e.g., office building heating, car fleet emissions.
Scope 2: Indirect GHG emissions from the generation of purchased electricity, steam, and heating/cooling consumed by the company.
Scope 3: All other indirect emissions not covered in scope 2, such as extraction and production of purchased materials; transportation of purchased fuels; and use of sold products and services, business travel, employee commuting etc.
During the UN Climate Conference in Paris in 2015, PUMA agreed to set a science-based CO2 emissions target. In 2018, PUMA co-founded the Fashion Industry Charter for Climate Action, an industry-wide coalition which aims to align the fashion industry’s emissions with the targets included in the Paris Agreement.
One year later, PUMA agreed and published its science-based emission target (SBT) with the SBT Coalition and joined the Fashion Pact, which also includes a climate action commitment.
We combined our SBT agreement with an increased effort to support the use of renewable electricity by purchasing RECs for countries where PUMA has a major presence and renewable electricity cannot be purchased directly. We purchased RECs worth 50% of PUMA’s emissions from electricity for 2018 retroactively and increased that figure to 74% in 2019 and to 100% in 2020 as well as 2021.
In this way, we managed to reduce our combined Scope 1 and 2 emissions significantly, despite an increased business volume. Compared to our baseline 2017 our combined Scope 1 and 2 emissions were reduced 88% (market-based). Taking our RECs purchase into account, we already have exceeded our science-based emissions target of 35% for Scope 1 and 2 emissions. We also exceeded the absolute 50% reduction required to align our target with a 1.5-degree scenario.
After having achieved 100% renewable electricity for the offices, stores and warehouses under our control, we continued to source only green electricity in 2021 through renewable energy tariffs and the purchase of renewable energy attribute certificates (RECs).
To further reduce our Scope 1 emissions, which can be attributed largely to the vehicles in our fleet, we increased the number of zero or low emission cars globally to 108, or 15% of our global PUMA car fleet. For the future we plan to increase the number of cars with alternative engines by 10% each year.
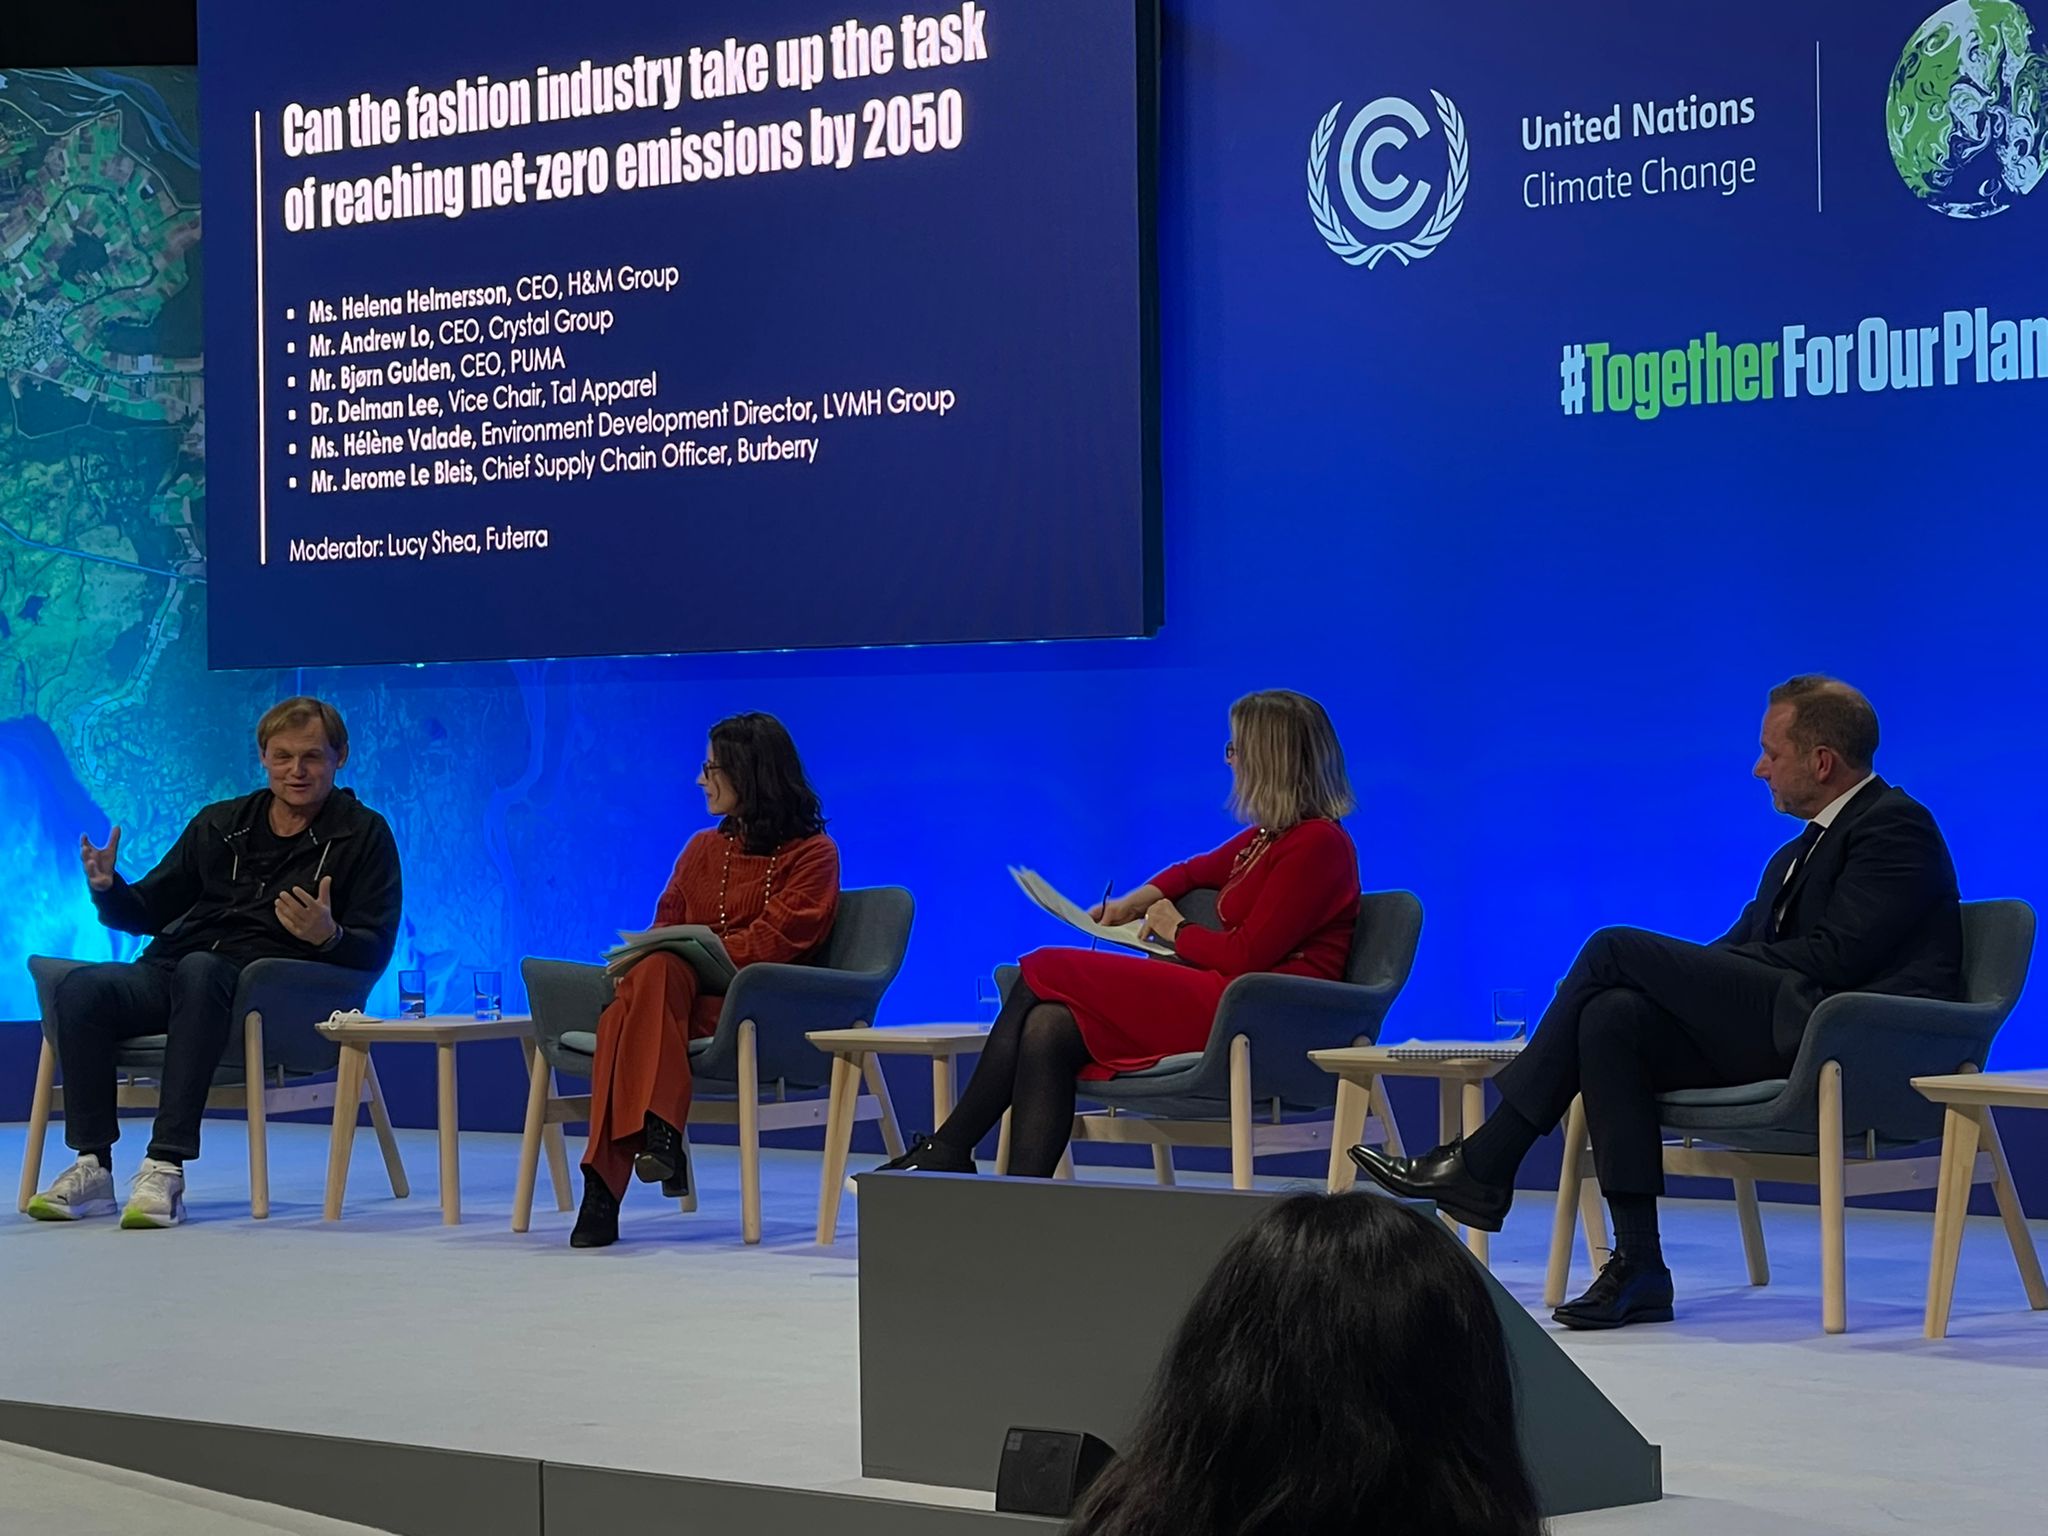
During the UN Climate Conference in Glasgow, PUMA CEO Bjørn Gulden confirmed PUMA’s commitment to the new targets of the Fashion Industry Charter for Climate Action, released on the 5th of November 2021. UNITED NATIONS (unfccc.int)
Over the coming years we will aim to replace the RECs certificates with renewable energy tariffs and/or power purchase agreements where possible, and, as mentioned above, expand the percentage of cars equipped with alternative engines by 10% each year.
For our Scope 3 emissions, we decided to focus on purchased goods and services, since this is also the category in which most of our indirect emissions are created. In addition, we set a target to reduce emissions from the transport of goods by 20% relative to the volume transported, mainly through reducing our air-freight ratio by 5% each year on a 2019 baseline.
To reduce the emissions from the production of our PUMA goods, we worked with our suppliers on several programs ranging from energy efficiency to installing on-site solar photovoltaic power plants to generate renewable energy.
The Carbon Disclosure Project (CDP) is an investor-led coalition that ranks global companies and cities for their climate strategies and disclosure. PUMA has been a long-term participant with the CDP and we make our answers to the CDP questionnaire publicly available via the CDP website. In 2021, for the first time in our PUMA history, we received an A- score for our climate disclosure with CDP for the reporting year 2020, as well as a supply chain score of A.
PUMA’s rating is better than the average performance of the sector (textile and fabric goods) with an average rating of C. The overall global average rating stands at B-.
Our improvement in the CDP rating came as recognition of various climate actions initiated during 2020 and 2021. This includes various emission reduction initiatives undertaken, including a detailed climate action roadmap, expansion of cleaner production projects in key sourcing countries, feasibility studies for onsite renewable energy opportunities and subsequent adoption of renewable energy by some of the PUMA core suppliers. Furthermore, we also received higher ratings in our improved governance system for climate action, risk disclosure and reduction in Scope 1 and 2 emissions.
The Taskforce for Climate Related Financial Disclosures (TCFD) is an international financial initiative, aiming for more transparency between companies and investors on climate- related topics. At PUMA, we have mapped our existing climate disclosures against the TCFD recommendations, and provided a summary in table T.11 below.
|
Thematic area |
Recommended disclosures |
Source of information in |
Focus in 2021 |
|
Governance |
|
|
|
|
Disclose the organization’s governance around climate-related risks and opportunities. |
a) Describe the board’s oversight of climate-related risks and opportunities.
b) Describe management’s role in assessing and managing climate-related risks and opportunities. |
AR p. 40-41* CDP C1.1
CDP C1.2 |
Created supervisory board sustainability committee.
|
|
Strategy |
|
|
|
|
Disclose the actual and potential impacts of climate-related risks and opportunities on the organization’s businesses, strategy, and financial planning where such information is material. |
a)
Describe the climate-related risks and opportunities the organization has
identified over the short, medium, and long term. b)
Describe the impact of climate-related risks and opportunities on the
organization’s businesses, strategy, and financial planning. c) Describe the resilience of the organization’s strategy, taking into consideration different climate-related scenarios, including a 2°C or lower scenario. |
CDP C2
CDP C2.3 CDP C2.4
AR p. 80* |
Climate-related risks and opportunities are part of the PUMA corporate risk assessment process and published in detail in our answer to the Carbon Disclosure Project. The consideration of the resilience of the organization’s strategy for well-below 2 °C scenario is part of our existing science-based target. |
|
Risk Management |
|
|
|
|
Disclose how the organization identifies, assesses, and manages climate-related risks. |
a) Describe the organization’s processes for identifying and assessing climate-related risks.
b) Describe the organization’s processes for managing climate-related risks
c) Describe how processes for identifying, assessing, and managing climate-related risks are integrated into the organization’s overall risk management. |
AR p. 42-43* CDP C2.2
AR p. 42-43*, 75* CDP C2.2
AR p. 42-43* |
Climate-related risks are part of the PUMA corporate risk assessment process and are managed as part of our climate targets and climate-action program. |
|
Metrics and Targets |
|
|
|
|
Disclose the metrics and targets used to assess and manage relevant climate-related risks and opportunities where such information is material. |
a) Disclose the metrics used by the organization to assess climate-related risks and opportunities in line with its strategy and risk management process.
b) Disclose Scope 1, Scope 2, and, if appropriate, Scope 3 greenhouse gas (GHG) emissions, and the related risk
c) Describe the targets used by the organization to manage climate-related risks and opportunities and performance against targets. |
AR p. 79-86* CDP C6, C10
AR p. 79-86* CDP C6, C10
AR p. 70-72* CDP C4.1, C4.2 |
PUMA has precise metrics and targets concerning its greenhouse gas emissions. In 2022, PUMA is working on aligning its science-based target with a 1.5 °C scenario. |
In 2021 we developed a climate roadmap and conducted a risk assessment using our risk assessment methodology.
We see a regulatory landscape with unfavorable policies for renewables in some countries as a high risk. Furthermore, unstable business in our industry overall can restrain suppliers from investing in technologies and upgrading their facilities with low carbon machinery.
Below are key focus areas for the coming years. Some actions have been taken in 2021 and are reported in this report.
In 2021, PUMA joined hands with other brands and key suppliers under the UN led “Fashion Industry Charter for Climate Action" to develop a standard training program on climate action for Apparel and Footwear suppliers in Asia, in partnership with the German Development Agency, GIZ. This online training program provides foundational knowledge to suppliers on global decarbonization efforts, GHG emissions accounting, climate target setting methodology and solutions to reduce emissions and achieve these targets. The training is available in English and other local languages such as Khmer, Mandarin, Bengali and Vietnamese. We encouraged our suppliers to participate in this self-paced online training course available free of cost.
We also nominated 36 participants from 13 core suppliers in Vietnam, Cambodia, Bangladesh and Pakistan to join a tutor-assisted training program by GIZ; 92% of participants obtained a certificate with an average score of 72% with the final exam.
In addition to the above 34 participants for the tutor-guided course, so far 30 participants from 25 supplier factories have completed the course and attempted the final exam. 86% of the participants have successfully passed the exam and obtained the certificate from GIZ, with an average score of 75%.
We developed a training module with the objective of creating awareness among PUMA sourcing colleagues so that we can integrate climate change into business discussions with suppliers. 50 of our sourcing colleagues learned the basics of climate change, international agreements, PUMA’s climate change targets and roadmap, and suppliers’ target-setting. Refresh training will be conducted in 2022.
During 2021 we developed two training modules for our core suppliers to drive forward climate target-setting. One module focuses on the group of suppliers which need to establish science-based targets, and the other one targets the group of suppliers which need to establish climate targets based on a simplified tool developed in-house. To identify each group, we conducted a readiness level mapping of Core T1 and T2 suppliers with a survey based on the following criteria:
In line with the survey outcome, we identified 10 T1 suppliers which contribute towards 60% of business volume and 23 T2 suppliers, which account for 51% business volume to join our climate action programs in 2022.
Furthermore, to improve the awareness level of employees, we have developed a foundational eLearning training module for all employees. This module is in the final stage of development and is expected to be rolled out in the first half of 2022.
Our core suppliers are involved in different climate action programs (details in the table T.12 below). Overall achievements are:
Cleaner Production / Coal phase out programs
|
Country |
Program/Partner |
Scope |
Number of factories |
% Sourcing volume (globally) |
|
China-Taiwan |
Clean-by-Design(CbD)/aii |
Energy and water efficiency |
T2: 4 |
2021 Tier 1 – 51% Tier 2
– 63% Enrolled in 2022 Tier 1 – 69% Tier 2 – 71% |
|
Low Carbon Manufacturing Program (LCMP)/WWF |
Energy and water efficiency |
T1: 10 |
||
|
Bangladesh |
Partnership for Cleaner Textile (PaCT)/IFC |
Energy and water efficiency |
T1: 7 T2: 3 |
|
|
Vietnam, Cambodia |
Clean-by-Design(CbD)/aii, FABRIC/GIZ |
Energy and water efficiency, Coal phase out |
T1: 6 T2: 9 |
|
|
Vietnam Improvement Program (VIP)/IFC |
Energy and water efficiency |
T1: 4 T2: 6 |
||
|
Mexico |
Sustainable energy for all |
Energy efficiency |
T1: 2* |
|
|
Total |
|
|
T1: 43 T2: 27 |
|
|
|
|
|
|
|
* Non-core factories
Renewable energy programs
|
Country |
Program/Partner |
Scope |
Number of factories |
% Sourcing volume (globally) |
|
Vietnam, Cambodia |
Project Development Program (PDP)/ GIZ |
Rooftop Solar |
T1: 6 T2: 1 |
2021 Tier 2 – 18%
Enrolled in 2022 Tier 1 – 69% Tier 2 – 70% |
|
Self-initiative by factories |
Rooftop Solar |
T1: 3 T2: 2 |
||
|
China-Taiwan |
Self-initiative by factories |
Rooftop
Solar, |
T1: 4 T2: 6 |
|
|
Bangladesh |
Partnership for Cleaner Textile (PaCT)/IFC |
Rooftop Solar |
T1: 2 T2: 3 |
|
|
Self-initiative by factories |
Rooftop Solar |
T1: 1 |
||
|
Project Development Program (PDP)/ GIZ |
Rooftop Solar |
T1: 3 |
||
|
Pakistan |
Project Development Program (PDP)/ GIZ |
Rooftop Solar |
T1: 2 |
|
|
Total |
|
|
T1: 21 T2: 12 |
In Bangladesh, DBL Group’s sustainability is based on five pillars: People, Process, Product, Community and Environment. Environment is a high priority for DBL Group, and they work to decrease carbon footprint, water consumption and waste from their manufacturing processes. DBL used 10,730 tons of recycled cotton in 2021. By increasing renewable energy use, it reduced its CO2 emissions by 1,934 tons per year. DBL collects water from rainwater, this water is used as process water for dyeing, finishing, printing and washing, saving 100,850 cubic meters of groundwater up to 2021.
In Turkey, SLN is a founding signatory of the UNFCCC Fashion Industry Charter for Climate Action since 2018 as the first manufacturer. In January 2021 all SLN facilities started to use I REC certified clean and renewable electricity. The market-based carbon emissions from the electricity consumption of all SLN facilities is therefore 0 (zero) as of January 2021.
In a time when the global COVID pandemic has wreaked havoc in the fashion sector, the climate crisis has only become more urgent and serious. The support and visible commitment demonstrated by PUMA’s CEO, Björn Gulden’s participation in the Charter’s event at COP 26 in Glasgow, therefore sent a strong and positive signal of commitment that also helped the wider fashion sector to join hands in moving faster into a climate smart future. Stefan Seidel, PUMA’s Head of Corporate Sustainability, has also competently and with great passion guided the Charter’s work in his role as co-chair of the Fashion Charters steering committee. PUMA is one of many leading fashion companies that have now made an ambitious, and necessary, commitment to align its operations with the Paris Agreement goal to keep global warming below 1.5 degrees C. The eyes of the world will now look to PUMA and is peers in the Fashion Charter to continue to show leadership and make good on those commitments. UNFCCC is looking forward to continuing working with one of the truly leading fashion brands in the area of real climate action.
NICLAS SVENNINGSEN
Manager, Global Climate Action, United Nations Climate Change
|
CO2e emissions1-6 |
2021 |
2020 |
2019 |
2018 |
2017 |
% Change 2020/2021 |
% Change 2017/2020 |
|
Scope 1 – direct CO2e emissions fossil fuels |
4,046 |
4,179 |
6,326 |
6,918 |
7,678 |
-3% |
-47% |
|
2,008 |
1,985 |
3,618 |
4,073 |
4,134 |
1% |
-51% |
|
|
2,039 |
2,194 |
2,708 |
2,845 |
3,545 |
-7% |
-42% |
|
|
Scope
2 – indirect CO2e emissions |
32,545 |
29,839 |
40,986 |
43,366 |
40,029 |
9% |
-19% |
|
Scope
2 – indirect CO2e emissions |
1,458 |
1,078 |
11,533 |
22,128 |
40,029 |
35% |
-96% |
|
31,087 |
28,761 |
39,282 |
42,145 |
38,914 |
8% |
-20% |
|
|
0 |
0 |
9,828 |
20,907 |
38,914 |
- |
-100% |
|
|
1,458 |
1,078 |
1,705 |
1,221 |
1,115 |
35% |
31% |
|
|
Total Scope 1 and 2 (location-based) |
36,591 |
34,018 |
47,312 |
50,284 |
47,707 |
8% |
-23% |
|
Total Scope 1 and 2 (market-based) |
5,504 |
5,257 |
17,858 |
29,046 |
47,707 |
5% |
-88% |
|
Scope 1
and 2 relative to sales |
5.4 |
6.5 |
8.6 |
10.8 |
11.5 |
-17% |
-53% |
|
Scope 1
and 2 relative to sales |
0.8 |
1.0 |
3.2 |
6.2 |
11.5 |
-19% |
-93% |
* Including renewable energy attribute certificates
As indicated in T12 and G12, PUMAs own emissions from Scope 1 and 2 (market based) have been reduced by 88% between our baseline year 2017 and 2021. Therefore, we already exceeded our Science Based Target of 35% reduction until 2030. The reduction is mainly due to purchasing renewable electricity where available, and renewable energy attribute certificates where no renewable energy tariffs are available.
|
CO2e emissions1-6 |
2021 |
2020 |
2019 |
2018 |
2017 |
% Change 2020/2021 |
% Change 2017/2020 |
|
Scope 3 – indirect CO2e emissions from corporate value chain |
264,005 |
211,108 |
250,240 |
222,315 |
208,525 |
25% |
27% |
|
Purchased
goods and services – |
150,509 |
113,561 |
123,769 |
126,590 |
123,061 |
33% |
22% |
|
Fuel- and energy-related activities* |
3,136 |
2,855 |
|
|
|
10% |
|
|
Upstream transportation and distribution |
106,983 |
91,775 |
107,744 |
80,143 |
71,070 |
17% |
51% |
|
85,622 |
67,842 |
98,386 |
74,182 |
64,076 |
26% |
34% |
|
|
21,361 |
23,933 |
9,358 |
5,961 |
6,994 |
-11% |
205% |
|
|
Business travel (rail and air) |
2,482 |
1,751 |
18,727 |
15,582 |
14,394 |
42% |
-83% |
|
Upstream leased assets* |
895 |
1,166 |
|
|
|
-23% |
|
|
Total Scope 1-3 (market-based) |
269,509 |
216,365 |
268,098 |
251,361 |
256,232 |
25% |
5% |
|
Annual sales PUMA (in € million) |
6,805 |
5,234 |
5,502 |
4,648 |
4,136 |
30% |
65% |
|
Total
Scope 1-3 relative to sales |
39.6 |
41.3 |
48.7 |
54.1 |
62.0 |
-4% |
-36% |
|
Total
Scope 3 relative to sales |
38.8 |
40.3 |
45.5 |
47.8 |
50.4 |
-4% |
-23% |
* Emissions from the respective Scope 3 categories were reported under Scope 1 and 2 before 2020.
** In 2020 upstream outbound values were adjusted to fully cover e-commerce business and exclude B2B express volumes.
1. PUMA’s greenhouse gas reporting is in line with the GHG Protocol International Accounting Standard.
2. Methodological changes over the last three years have influenced results. In 2020 updated emission factors were applied and the consolidated structure changed due to full alignment with the GHG Protocol.
3. The consolidation scope follows the operational control approach, including PUMA-owned or operated offices, warehouses, stores and own industrial sites (Argentina).
4. Outsourced Tier 1 production is accounted for in the Scope 3 emissions under purchased goods and services, covering CO2 emissions from all three product divisions (Accessories, Apparel and Footwear).
5. PUMA applied emission factors from internationally recognized sources, such as the International Energy Agency (IEA) (2019) and DEFRA Conversion Factors (2020). For some Scope 3 emissions, emission factors are based on supplier and industry-specific emission factors.
6. For sea freight transportation, PUMA follows the recommendation and new methodology of the Clean Cargo Working Group that has transitioned from the use of tank-to-wheel (TTW) CO2 to well-to-wheel (WTW) CO2-equivalent emission factors for all fuels.
Scope 3 emissions come from PUMA’s indirect business activities, mainly in the supply chain.
In previous years we reported our Scope 3 emissions for the production of PUMA goods by our suppliers only at Tier 1 supplier level in our Annual Report. In addition, we also used the PUMA EP&L calculations and results for our science-based CO2 target setting and tracking.
In 2021 we engaged lifecycle expert company Sphera to conduct a comprehensive assessment of our supply chain emissions beyond Tier 1 manufacturing, including Tier 2 manufacturing of fabrics and components as well as material production. With this data we aim to set a new baseline for our most important Scope 3 category 1, “purchased goods and services”.
We can therefore see in the table below that our absolute emissions from the purchased goods and services category have decreased by 12% from 2017 to 2021 while our business has grown by 65%. Due to efficiency improvements and the use of renewable electricity at factory level, as well as the usage of more sustainable materials, our emissions relative to sales have decreased by 46% in the same period, in line with our Science based target of 60% reduction relative to sales until 2030.
|
Scope 3 Emissions (Category -1) |
2017 (Baseline) |
2020 |
2021 |
% Change 2017/2021 |
|
Absolute GHG emissions (t CO2 eq) |
1,409,265 |
1,389,335 |
1,242,468 |
-12% |
|
Annual sales turnover (€ m) |
4,136 |
5,234 |
6,805 |
65% |
|
GHG intensity (tCO2e/€ m turnover) |
341 |
265 |
183 |
-46% |
Note:
Scope 3 category 1 estimation includes GHG emissions associated with goods and services purchased by PUMA from its suppliers related to PUMA products and associated packaging. This excludes emissions associated with other goods and services acquired by PUMA offices, stores and warehouses.
Scope 3 category-1 emissions mainly originate from two sources; the raw materials and the energy consumed by our Core T1, T2, T3 (production of raw material) suppliers to produce finished materials and components, as well as finished goods. The breakdown of total GHG emissions by sources is presented below.
We are currently working with the Sphera team to also quantify the GHG emissions for the years 2018 and 2019 as well as additional Scope 3 categories.
The share of renewable electricity sourcing by Tier-1 and Tier-2 suppliers has increased from 0.35% in 2017 to 4.3% in 2021, which marks a 1673% jump in renewable electricity sourcing. Looking at the tiers in the value chain the share of renewable electricity has increased from 0.18% in 2017 to 4.8% in 2021 by T1 suppliers, while it has increased from 0.74% to 3.1% for T2 suppliers during the same period.
|
|
2017 |
2020 |
2021 |
% Change 2017/2021 |
|
Total Renewable Electricity (kWh) |
817,644 |
3,588,937 |
14,494,042 |
1673% |
|
Total Grid Electricity (kWh) |
234,323,351 |
252,665,750 |
324,910,084 |
39% |
|
Share of Renewable Electricity |
0.35% |
1.40% |
4.3% |
1128% |
|
Core T-1 Renewable Electricity (kWh) |
298,283 |
1,999,458 |
11,149,103 |
3638% |
|
Core T-1 Grid Electricity (kWh) |
164,904,224 |
169,593,745 |
218,804,548 |
33% |
|
Share of Renewable Electricity (Core T-1) |
0.18% |
1.17% |
4.8% |
2585% |
|
Core T-1 Renewable Electricity (kWh) |
519,361 |
1,589,479 |
3,344,939 |
544% |
|
Core T-2 Grid Electricity (kWh) |
69,419,127 |
83,072,005 |
106,105,536 |
53% |
|
Share of Renewable Electricity (Core T-2) |
0.74% |
1.88% |
3.1% |
312% |
Note:
The total electricity does not include captive electricity generation from fossil fuels such as natural gas, diesel etc.
The renewable energy includes iREC certificates purchased by core leather, polyurethane, textile factories in 2021, but excludes renewable energy sourced by the Tier 2 core factories e.g., packaging & labelling, trims, footwear bottom and knitted upper
|
Scope 3 Emissions (category-1) |
2017 |
2020 |
2021 |
% Change 2017/2021 |
|
Absolute GHG
Emissions from Tier 1 and Tier 2 suppliers |
345,361 |
297,573 |
358,404 |
4% |
|
Annual sales turnover (€ m) |
4,136 |
5,234 |
6,805 |
65% |
|
GHG Intensity (tCO2e/ turnover in millions) |
83.5 |
56.8 |
52.7 |
-37% |
|
Absolute GHG emissions from Tier 3 suppliers (t CO2e) |
252,251 |
223,909 |
284,215 |
13% |
|
GHG Intensity (tCO2e/ turnover in millions) |
61.0 |
42.8 |
41.8 |
-32% |
Note:
T1 & T2 emissions are estimated based on actual energy consumption collected from Core T1 and T2 factories and extrapolated to cover all T1 and T2 supplier factories.
T3 emissions are estimated by Sphera by using its GaBi database
With a closer look at the emissions from our supply chain, we see that absolute GHG emissions from T-1 and T-2 suppliers have been increasing by 4%, while the GHG intensity relative to the sale turnover has declined by 37% from 2017 to 2021.
Absolute GHG emissions from T-3 suppliers increased by 13%, while the GHG intensity relative to sales turnover declined by 32% from 2017 to 2021. This is mainly achieved through better material selection by gradually switching to more sustainable materials and probably due to better material efficiency. Starting in 2022, we plan to closely track the material efficiency of our products.
We see opportunities to further scale up cleaner production and renewable energy programs to more T1 and T2 suppliers, and also to launch them at some of the spinners (T3).
Drilling down into product divisions, the absolute emissions are reduced at the leather tanneries by 33%, followed by Footwear T1 factories by 14%. Whereas the emissions from synthetic leather and Textile T2 factories is increasing by 214% and 15% respectively. The increase in emissions from synthetic leather factories and decrease in emissions from leather tanneries is mainly due to the increasing replacement of leather with synthetic leather. The GHG contribution by product divisions is presented below.
Note:
T1: Apparel, Footwear & Accessories factories
T2: Leather, textile, polyurethane factories
Absolute GHG emissions from raw material consumption are decreasing by 26% as the total material consumption itself is increasing by 19%, while the GHG intensity of materials is reducing by 55% since 2017. This is achieved due to our continuous endeavours to shift towards more sustainable materials, for example. More sustainable cotton and polyester increased from 40% and 47% respectively in 2017 to 99% and 80% respectively in 2021.
|
|
2017 |
2020 |
2021 |
% Change 2017/2021 |
|
Total raw materials (T) |
158,509 |
195,039 |
187,996 |
19% |
|
GHG emissions from materials (tCO2e) |
811,654 |
867,853 |
599,849 |
-26% |
|
Annual sales turnover (€ million) |
4,136 |
5,234 |
6,805 |
65% |
|
GHG intensity (tCO2e/turnover in millions) |
196.2 |
165.8 |
88.1 |
-55% |
Assumptions: During the Scope 3 assessment, it was observed that the material data collection has improved over time and recently we are able to comprehensively collect material data. For example, for 2017 material data was not available for all type of materials and some material data were incomplete. In the absence of comprehensive raw material data for 2017, material data is extrapolated from 2020. Furthermore, we observed that the polyester consumption data for Footwear was exceptionally high for 2020 and possibly erroneously overestimated. Therefore the polyester data for Footwear for 2017 and 2020 are extrapolated from 2019 data.
A breakdown analysis as shown in the chart below indicates that rubber contributes the most, followed by leather and polyester. The emissions share of polyesters has reduced from 12% in 2017 to 8% in 2021 and that of leather has reduced from 21% to 20%, whereas the share of rubber has decreased from 33% to 27%. Hence it confirms that our focus on increasing the usage of recycled polyester and offering recycled alternatives to conventional rubber and leather, as defined in our 10FOR25 targets, will help to reduce greenhouse gas emissions.
We started collecting data for transit plastic packaging from 2021, and 100% are recycled.
Downstream impacts are not covered in category 1 (purchased goods and services) and will be reported in our 2022 annual report.
Note:
Others include viscose, acrylic, linen, lycra, metals, adhesives etc.
Leather is natural leather while polyurethane is imitation leather, also known as synthetic leather.
Target description:
Relates to Sustainable United Nations Development Goals 3 and 6
KPIs:
PUMA follows the precautionary principle and takes measures to prevent harm to human health and the environment from its products and operations.
All the materials used in PUMA products are subject to our Restricted Substance List (RSL) Testing Program to ensure compliance with global chemicals regulations. Rather than applying internal testing standards, for our tests, we rely on the AFIRM Group’s Product RSL and on the Manufacturing RSL developed by the Zero Discharge of Hazardous Chemicals Foundation (ZDHC).
In 2021 we changed our target from less than 1% RSL failure rate to maintain the RSL compliance rate above 90%, to allow for increased new material development and innovation, where each material is tested, and hence more failures can happen. In any case, no material with a failed RSL test can be used for PUMA products until the failure has been corrected and the material has successfully passed the test. In this way we mitigate the risk of product-level RSL failures. We will still track our RSL failure rates to identify improvement opportunities and prevent such failures from occurring in the future.
At the manufacturing level, as part of our Zero Discharge of Hazardous Chemicals commitment we continued to ban the intentional use of priority chemical groups classified as particularly hazardous under ZDHC standards. This phase-out was supported by the widespread use of bluesign® and OEKO-TEX®-certified materials. While the use of most of these chemical groups was never intentional, poly-fluorinated and per-fluorinated chemicals (PFCs) were used until 2017 for water repellent finishes on Apparel and Footwear products. In 2021 we re-started to use Gore-Tex bluesign®-certified membranes and finishes which are either completely PFC-free or free from PFCs of environmental concern. In February 2017 Gore announced the “Goal and Roadmap for Eliminating PFCs of Environmental Concern (PFCEC)” from the lifecycle of its consumer fabrics products following discussions with Greenpeace. Gore Fabrics Division is still fully committed to the PFCEC-free goals for its consumer products and is now on track to transition the vast majority of its portfolio by the end of 2025.
Our phase-out of hazardous substances is also reflected in the results of wastewater tests performed by our wet-processing suppliers. The tests show compliance levels of over 93% for the 14 MRSL parameters listed in the ZDHC MRSL. Most parameters show compliance rates of 100% or close to 100%. Some MRSL chemicals were still found in certain samples because we share production lines with other brands and retailers.
There is a total of 179 ZDHC Gateway accounts connected with PUMA. 34 are Core T1 and 65 Core T2 factories and the remaining are non-core factories. These factories are part of different ZDHC programs, depending on what applies to them: InCheck reports for MRSL conformance, ClearStream reports for wastewater conformance and the Supplier To Zero program for chemical management.
In 2021 we conducted a risk assessment using our risk assessment methodology.
We used the Higg FEM chemical management 2020 score with our core suppliers and engaged with AFIRM and the ZDHC foundation to review our risk assessment.
We see a high risk for upcoming regulatory requirements. We will keep our engagement with AFIRM and FESI as the platforms to engage with policy makers in different regions and countries, such as the EU and US.
PUMA has had a long-lasting program to ensure compliance with industry standards, we also updated our chemical handbook and increased the number of supplier trainings in 2021. These are the reasons why we see a low risk to factory workers’ and communities' health and medium risk of product claim.
We will keep using the China IPE database to screen any environmental violations by factories located in China producing PUMA products or materials. We will keep monitoring the compliance with the ZDHC wastewater guideline, ZDHC MRSL and AFIRM RSL. We developed a tailored-made program for factories with lower RSL compliance rate, to improve their efficiency for materials to pass tests and optimize their testing procedure.
PUMA has moved from individual brand chemical and environmental audits to the use of industry-wide tools, such as the Higg Index Facility Environmental Module (FEM) 3.0. PUMA requires an annual external verification of the self-assessment FEM modules (verification visits are announced). This external verification may be completed by approved verifiers from PUMA’s internal team or other brands, or third-party organizations on the approved list from SAC. The FEM Chemical Management Section measures factory performance from inventory and purchasing, to production, storage and waste. PUMA’s Chemical Performance Rating System is based on the ratings developed from the factories’ verified Higg FEM scores under Chemical Management Section as verified by SAC approved verifiers: A, B+, B-, C and D.
This rating system was presented during suppliers and sourcing team meetings in 2021 and will be implemented gradually from 2022. Our chemical handbook has been updated accordingly. This rating system will be included in vendor supplier score cards along with social and environmental ratings in the future.
The table below shows the aggregated verified FEM2020 chemical module scores (median) for PUMA core factories with industry benchmarking. Compared to the industry, the verified FEM score overall for our factories is higher than the industry score.
* FEM 2020 PUMA average: 146 factories
Industry median FEM 2020 (4409 factories): filter used industry sector (Apparel, Footwear, Accessories includes handbags, jewelry, belts, and similar products) and Facility Type (Final Product Assembly, Printing, Product Dyeing and Laundering, Material Production including textile, rubber, foam, insulation, pliable materials)
In 2021 PUMA also facilitated our core factories to participate in the ZDHC Supplier To Zero program, which contains a chemical management checklist to help factories identify opportunities to improve their chemical performance. A total of 50 Core T1 and Core T2 factories have completed the ZDHC Supplier To Zero assessment: 48 are at foundational level while 2 are at progressive level. PUMA will continue reviewing progress and map good practice to share with our suppliers. In addition, we have conducted a good practice sharing session in chemical management at a suppliers’ meeting.
In 2022 we will continue to engage with our PUMA Core T1 & T2 factories in capacity building activities and projects in chemical management. Our target is to improve each factory’s verified FEM score for the chemical module to above 40%. We will continue together with industry expert groups like ZDHC and AFIRM to organize training webinars and to develop training videos in local languages. Supported by organizations such as GIZ (The Deutsche Gesellschaft für Internationale Zusammenarbeit – German Corporation for International Cooperation), and chemical experts, we will deliver more practical training and one-on-one coaching sessions. In 2022 PUMA will join the PIE (Program for Improvement of Environmental performance of factories) of GIZ in countries such as Vietnam, Pakistan and Bangladesh. PUMA will partner with other external consultants in China.
To help our suppliers better understand the requirements set by PUMA and the industry, we trained suppliers in standards, guidelines and tools, as well as methodology for nonconformance investigation and remediation. Case studies of conventional parameter failures have been used in the training.
In 2021, chemical management training sessions covered MRSL, factory chemical management (FEM), RSL, Wastewater and corrective actions for non-conformance. A total of 17 training sessions were conducted in 6 different languages. More than 470 factories and 1,400 participants were invited. More than 80% of participants were satisfied with the training arrangement and content.
Here are training sessions that have been organized in 2021:
|
Virtual training |
Topics |
Number of factories |
Number of participants |
|
Industry chemical management standards, guidelines and platforms
(Jointly organized with ZDHC)
Conducted in 2 different languages |
Chemical inventory and InCheck Report, Supplier To Zero (Chemical Management), Wastewater ClearStream Report, ZDHC Gateway, Conformance improvement with case study |
Approx. 132 |
Approx. 430 |
|
RSL
(Jointly organized with ZDHC and accredited third-party laboratory)
Conducted in 6 different languages |
RSL standard and testing matrix update and implementation |
Approx. 118 |
Approx. 375 |
Since 2019 we have increased the number of RSL tests from 6,605 to 8,184 with the overall RSL compliance rate maintained at above 98%. When materials fail an RSL test, they cannot be used for PUMA products until the failure has been corrected and they successfully pass the test. In this way we mitigate the risk of product-level RSL failures.
|
Product Division |
2021 |
2020 |
2019 |
|||
|
No. of test reports |
Compliance rate (%) |
No. of test reports |
Compliance rate (%) |
No. of test reports |
Compliance rate (%) |
|
|
5,847 |
98.8 |
5,117 |
99.3 |
4,668 |
99.2 |
|
|
1,467 |
99.0 |
1,318 |
98.9 |
1,239 |
99.1 |
|
|
737 |
94.4 |
878 |
96.8 |
639 |
96.2 |
|
|
133 |
97.7 |
152 |
91.4 |
59 |
100.0 |
|
|
Total |
8,184 |
98.4 |
7,465 |
98.8 |
6,605 |
98.9 |
Every year, PUMA performs random RSL testing for high-risk materials on finished products. In 2021 we tested 160 materials from 23 finished products from Footwear, Apparel, and Accessories from different suppliers in different sourcing regions. The pass rate was 96.9%.
In case of RSL failures, we check all products met all legal requirements in the selling countries. We also ask factories’ management to trace the concerned material to segregate it, so it is not used for production. To prevent further test failure, we work with our T1 factories to increase material test frequency for high-risk test failure before product manufacturing, and to improve the manufacturing process at T2 factories.
This program has been formulated based on the industry standards and PUMA requirements, focusing on input, process and output as defined in chemical management. Through this program we monitor closely the factory chemical management system (based on SAC FEM and ZDHC Supplier To Zero) and materials test protocol (especially for material with a high risk of RSL test failure). Factory materials’ testing process is then reviewed and optimized.
In 2021 the program was piloted with 7 suppliers (5 Footwear and 2 Accessories). In 2022 we will keep monitoring the performance of these 7 suppliers and expand the program to more suppliers.
In addition to testing materials and products via the RSL from the AFIRM Group, we also adopted the ZDHC Manufacturing RSL at supplier level.
GoBlu International has created an easy-to-use app (BHive) for chemical management in the supply chain. This app uses OCR technology which allows manufacturing facilities to take smart phone photos of chemical product labels, in order to generate a full and accurate chemical inventory. Within seconds, it identifies which chemical products meet MRSL requirements adopted by many brands/retailers. Facilities management can then see which chemicals they should keep using and which they should phase out — all at a glance.
During 2020 we successfully piloted BHive. As of end of 2021, 66 of our core factories used either BHive, CleanChain or E3 tools to track MRSL compliance.
Out of 146 core factories, 18 factories do not use chemical and/or water during the manufacturing process.
This means that 55% of T1 factories and 44% of T2 factories within the scope of our MRSL program have an Incheck report. We will follow up and support those factories to improve their MRSL conformance rate.
In 2022 we will focus on the remaining core factories. We will map if they use CleanChain or E3 tools to track their MRSL compliance, and if not, we will request them to use BHive by Goblu. We will also start launching this tool with non-Core T2 factories with wet processes.
With the help of our Footwear suppliers, we managed to further reduce the volatile organic compounds (VOCs) in grams per pair of shoes to 13.6 grams in line with our target for 2025. This reduction was a direct result of our long-standing VOC Program, which saw the first targets achieved as early as 2003. We are confident that the increase in use of hotmelt or water-based adhesives, and less VOC content in the products of major adhesive suppliers will help us achieve our VOC target of below 10gr/pair by 2025.
* Since 2019 figure-based for core suppliers in alignment with the general reporting scope
Target description:
Relates to United Nations Sustainable Development Goals 6, 14 and 15
Examples of the 10FOR25 action plan:
KPIs:
In 2021 we developed a water roadmap and conducted a risk assessment using our risk assessment methodology.
Water risk across PUMA supply chains was assessed referring to the WWF water stewardship criteria: Basin Risk and Operational Risk. Basin Risk was analyzed by the WWF Water Risk Filter. The Operational Risk was based on the water management in Higg FEM water management 2020 by our core suppliers. Those scoring under 50% were ranked with a high level of operational risk.
According to the analysis from WRI Aqueduct and WWF Water Risk Filter, some of our core suppliers in China, Vietnam and Bangladesh have some risks such as flooding, poor water quality or water depletion.
Below are key focus areas for the coming years. Some actions were taken in 2021 and are reported in this report.
We will prioritize core suppliers for further action by using the Water Risk Analysis tool.
Since 2015 we have increased the number of wastewater tests from 33 to 117 suppliers and 207 test reports, covering approximately 98% of our core wet-processing facilities.
The test results confirm that priority hazardous chemicals have been phased out as planned. Regarding the conventional wastewater parameters that apply only to suppliers which discharge their wastewater directly into natural water bodies. In 2021, test results show over 90% compliance with the ZDHC Wastewater Guidelines (foundational level). Seven parameters hit a 100% compliance level. This means we have achieved our wastewater target for 10FOR25 cycle. PUMA has continued to adopt the ZDHC ClearStream report for wastewater testing. For 2021, 113 out of 117 suppliers have a ZDHC ClearStream report.
In terms of heavy metals and the chemical parameters regulated in the ZDHC MRSL, the suppliers we tested were able to keep their high compliance rates above 90% for each parameter. The only exemption is antimony. As suggested by ZDHC, antimony was tested for reference only, considering the exemption of polyester manufacturing during which antimony is used as a catalyst. PUMA closely follows up the development progress with the ZDHC Task Team and the supply chain for better alternatives.
When a wastewater test fails, we support factories to conduct a wastewater and sludge root cause analysis and create corrective actions, using the industry standard template. In 2021 we received 4 action plans. We will follow up on their implementation through wastewater testing in 2022. In 2021 we conducted good practice sharing during the capacity building training to support factories to improve.
87 out of 117 factories are 100% compliant for all parameters as per ZDHC Wastewater Guidelines. Those that are not compliant are requested to improve.
* Antimony is exempt for mills that produce or dye polyester fabric.
To help our suppliers better understand the requirements set by PUMA and the industry, we trained suppliers in standards, guidelines and tools, as well as methodology for nonconformance investigation and remediation. Case studies of conventional parameter failures have been used in the training.
Here are 2021 training sessions that have been organized:
|
Virtual Training |
Topics |
Number of factories |
Number of participants |
|
MRSL and Wastewater
(Jointly organized with ZDHC and accredited third-party laboratory)
Conducted in 5 different languages |
MRSL standard and wastewater guideline update and implementation (use of industry platform and reporting) |
Approx. 86 |
Approx. 268 |
|
Root Cause Analysis and Corrective Actions
(Jointly organized with ZDHC and accredited third-party laboratory)
Conducted in 3 different languages |
Non-conformance investigation and remediation for MRSL, RSL and wastewater conformance |
Approx. 136 |
Approx. 330 |
|
|
|
|
|
In addition, we also encouraged the suppliers’ chemical management teams to attend in-depth training courses under ZDHC Academy as conducted by ZDHC approved service providers. These have been developed by industry experts and can be available in local languages. Examples of the training courses that have been attended by PUMA suppliers were ZDHC Top 10 Issues & best practices and the newly launched Chemical Management System (CMS) and Technical Industry Guide (TIG) training in 2021.
We see water savings of 2,424,800 m3 per year as a result of our core suppliers enrolled in a cleaner production program, which includes water efficiency action. Our Core Tier 1 suppliers have been able to reduce the amount of water per piece of apparel significantly by 44%, due to actions taken by our core factories in water efficiency through the Cleaner Production Program. We will now focus on our core footwear suppliers.
For data on water consumption, please refer to the Environmental Key Performance Indicator Section of this report.
The publication of the ZDHC Air Emission Guidelines was not finalized in 2021, so we decided to internally monitor our core supply chain’s performance regarding air emissions. We designed a set of questionnaires to gather the relevant air emission compliance information on top of our online Enablon data collection campaign for our core factories (T1 and T2). The result shows that 100% of the core factories sampled were compliant with the local regulation for air emission in 2021.
2021 PUMA CDP WATER SCORE: B-
PUMA’s CDP water score improved from C in 2020 to B- in 2021. Besides our consistent improvement on supply chain water efficiency, we clearly set up the water target to 15% water efficiency (water consumption reduction per unit of products manufactured) in 2025 compared to the baseline 2020.
Target description:
Relates to United Nations Sustainable Development Goals 3, 14 and 15
KPIs:
|
Sub-targets |
2020 |
2021 |
Target 2025 |
|
Plastic consumer shopping bags (stores, tons) |
400 |
190 |
0 |
|
Plastic consumer shopping bags recycled content (%) |
80% |
80% |
Zero plastic bags |
|
Plastic hangers used in stores (stores, tons) |
112 |
134 |
Switch to recycled content or wood |
|
Plastic hangers with 100% recycled content (%) |
51% |
97% |
100% |
|
Primary product plastic packaging (tons) |
245 |
4.7 |
Zero plastic packaging |
|
Plastic transit packaging (factory to warehouse) * (tons) |
|
557.7 |
Switch to recycled content or paper |
|
Plastic transit packaging recycled content (%) * |
|
100% |
100% |
|
Offices that have eliminated single-use plastic cups and cutlery (%) |
0% |
88% |
100% |
|
|
|
|
|
* We started to collect transit packaging (from factory to warehouse) data since 2021
Plastic pollution of our oceans is one of the most urgent challenges to sustainability of our time. As a company that uses polymers for most of its products, we have a special responsibility to work on this issue. Avoiding plastic pollution is also one of the three pillars of the Fashion Pact, of which PUMA is a founding member. Also, several countries and regions have formed initiatives to ban certain types of single-use plastics or plastic bags.
Therefore we have added Plastics and Oceans to our 10FOR25 sustainability strategy as well as our sustainability bonus targets.
Plastic shopping bags and single-use plastics aggravate the problem of plastic pollution significantly. By eliminating them from our stores and office environment we can set a positive example for our consumers and colleagues and at the same time reduce our use of plastics by several hundred tons per year.
In recent years we switched our shopping bags to FSC-certified paper bags or polyethylene bags with 80% recycled content. During 2020 our Retail division devised a detailed plan to completely phase out plastic bags from our global stores.
Our stores ordered 430 tons of polyethylene bags in 2019 and 400 tons in 2020. In 2021 our stores ordered 189 tons. By 2023 at the latest, we will replace all polyethylene bags for consumers with paper bags or durable multi-use bags for sale.
At the same time, we switched other plastic items in our retail stores, such as hangers and shoe fixtures, to recycled polymers or FSC certified wood. We also started working on more environmentally friendly solutions for our B2B product packaging for Apparel and Accessories, which is also based on polyethylene bags. As a result of these efforts, we switched our transit packaging B2B plastic bags to 100% recycled content. In addition we are also piloting transit bags made from paper in the USA.
During 2021 we also switched most plastic primary packaging B2C to paper (we reported 245 tons of plastic primary packaging used in 2020). At our offices we have challenged our catering partners and employees to avoid single-use plastics such as coffee cups, lids, stirring sticks, cutlery or straws. In 2021, 88% of our offices globally have already eliminated single use plastic cups and cutlery.
PUMA joined TMC (The Microfibre Consortium) to understand and address the environmental concerns for fibre fragments (microfibre) as generated from natural and synthetic clothing during manufacturing and the consumer use phase in the industry.
Microfibers originating from synthetic fibers can have an environmental impact and are a challenge for the industry. With this, PUMA has put more focus on testing synthetic materials, such as polyester. In 2021 we conducted 17 shedding tests (with 12 polyester 100%, 5 blended compositions) per TMC test method. In view of the test results analytics from TMC on 100% polyester, the average on filter mass change from PUMA fabrics was less than compared with that of the overall database average (PUMA = 0.0029g vs Overall = 0.0033g). This means that PUMA tested fabrics released less microfibers in mass compared to those tested fabrics from the TMC Microfibre Data Portal.
As feedback from TMC, we understand that analysis of the shedding data is complex and is to be on-going. At present there is no clear trend with the signatory’s data across the members from TMC in terms of yarn type or structure type. More data entries have been a call-out from TMC. PUMA will continue to participate and support the industry in the shedding study.
PUMA’s representative worked in the TMC task team with other industry representatives to develop a guideline: “Control of fiber fragmentation, within textile manufacturing wastewater”. The final draft is awaiting open consultation by different stakeholders, such as the ZDHC Foundation, prior to public release. PUMA will review the official version of the guideline upon release. PUMA has also participated in the development of a biodegradability report on the available test methods and claims. This could support alignment within the industry.
In September 2021 TMC released the 2030 roadmap. It has laid down its committee with clear accountable outputs - enabling signatories from across the industry to take meaningful, science-based, coordinated action on fiber fragmentation from natural and synthetic textiles. PUMA will continue to support the TMC roadmap and commitment, including building understanding by contributing to research data on fiber fragmentation, reducing fiber fragmentation by adopting mitigation actions once practically available from the industry, drive progress by participating in Task Teams and scaling global uptake.
Target description:
Relates to United Nations Sustainable Development Goals 9, 12, 14 and 15
KPIs:
In 2021 we launched our PUMA Circular Lab and announced as first concrete project the RE:SUEDE, an experiment for a biodegradable shoe, made with chrome-free Zeology leather, hemp, cotton and biodegradable TPE sole, which will launch in 2022 with a first batch of 500 pairs.
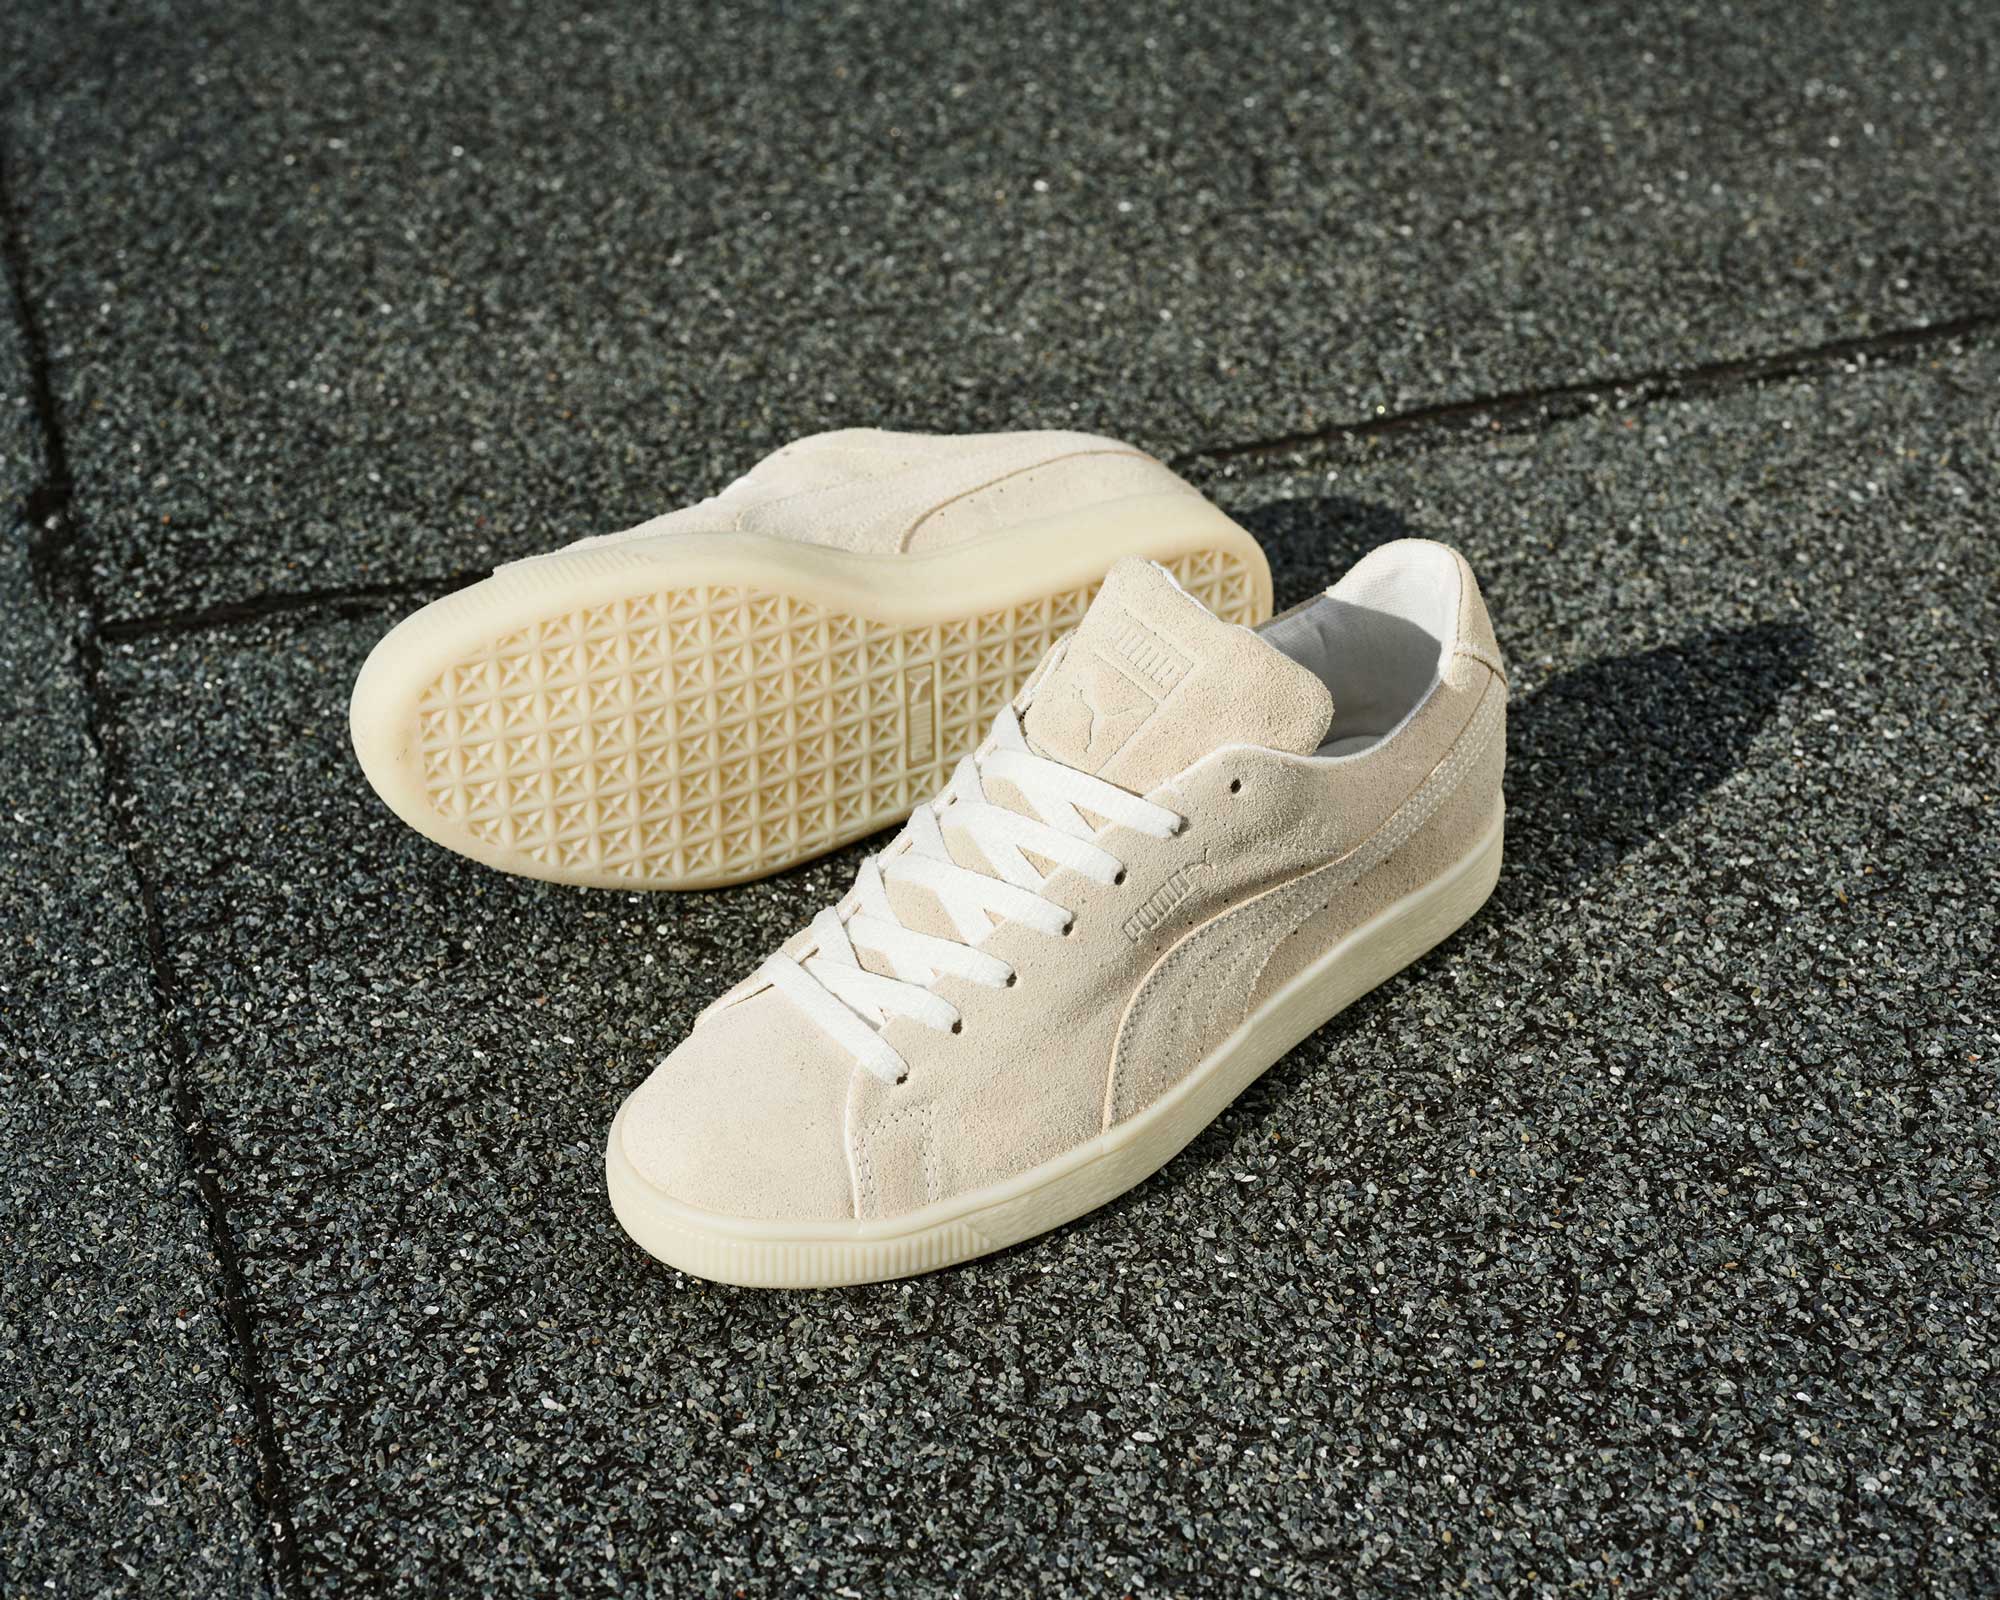
RE:SUEDE
RE:GEN collection
PUMA’s exploration of the issue of circularity dates back to 2011 when we partnered with Cradle-to-Cradle co-founder Michael Braungart. Our rich history as the first company in our industry to develop a Cradle-to-Cradle-certified collection – our InCycle collection launched in 2013 – led us to put circularity back on the agenda with our 10FOR25 sustainability strategy.
We are aware that the linear business model currently applied in our industry is far from the ideal concept of a circular economy. Rethinking the way we produce and moving towards a more circular business model is one of the priorities of our sustainability strategy.
Therefore we have set circularity targets for PUMA, for example, scaling up the use of recycled polyester and cotton and using recycled alternatives to leather, rubber and polyurethane (PU), the materials we use most frequently after cotton and polyester.
We have also started to encourage our suppliers to reuse and recycle the fabric waste they are creating for production, either through applications outside of our industry or ideally, by recycling offcuts into new polyester or cotton yarns.
At the end of 2021 our material toolboxes included recycled options for all the above materials and nylon. For recycling and recycled PU, we have started a research project with chemical company Covestro and shared first insights during our stakeholder dialog in 2021. Our Circularity Strategy was one of the two main topics discussed during our stakeholder dialog.
During 2021, building on our training with Circle Economy, we rolled out an e-learning tool on Circularity for the global PUMA colleagues. Based on the PUMA identity and our material toolboxes we identified circular design approaches around the longevity and cyclability of our products. The e-learning focuses ont our new Circularity Policy, as well as our circular design guidelines.
Regarding Apparel products, we developed a textile-to-textile recycling opportunity with partners in Europe. The initiative enables the recycling of unsellable polyester items (for example due to expired licensing contracts) through an innovative chemical recycling process into new textile items.
To communicate our use of recycled materials, we continued our First Mile collection made from recycled plastic bottles and expanded the concept into all our Business Units. In 2021 we also launched our Re.Gen collection made from recycled cotton, recycled leather straps and recycled polyester.
The use of recycled cotton for our Apparel products increased from 0.6% in 2020 to 2.3% in 2021, and for Footwear it increased from 0.5% to 4%.
The use of recycled polyester increased for all product divisions from 14% in 2020 to 43% in 2021.
More than 60% of pre-consumer waste is either reused or recycled by our Core T1 and T2 suppliers as of 2021, with only 4% of waste ending up in landfills for Apparel suppliers and 14% for Footwear suppliers.
|
Volume of recycled leather, from production waste |
1.2 tons |
|
|
Volume of recycled cotton, from production waste |
1,147 tons |
|
|
Volume of recycled polyester, from post-consumer waste |
16,799 tons |
|
|
Volume of recycled nylon, from post-consumer waste |
159 tons |
|
|
|
Core T1* |
Core T2** |
|
Quantity of pre-consumer waste generated annually |
43,459 tons |
78,210 tons |
|
% of pre-consumer waste sent to reuse or recycling |
62.4% |
79.4% |
|
% of textiles and fabric destroyed (sent to incineration) |
7% |
0.4% |
|
|
|
|
* Includes Core Tier 1 suppliers, apparel, footwear, and accessory (62 factories), not including Cobra
** Includes Core Tier 2 suppliers, leather, synthetic and textile (43 factories)
To demonstrate our responsibility as a producer and to secure options for more circular material streams in the future, we also have set the target to offer takeback schemes in all our major markets by 2025.
In our efforts to extend the lifespan of our products and re-integrate used materials into our production, we operate a project group headed by our Retail division.
Since September 2019, PUMA customers in Hong Kong have the possibility to put their used sportswear to good use and support disadvantaged communities across the world, as the sports company teams up with non-profit organization Crossroads Foundation. Hong Kong customers can donate used garments of all brands at PUMA recycling bins, which have been set up in 4 selected stores. For every bag of clothing that is donated, customers receive a 20% discount voucher for their next purchase. 130 kg and 104 kg of garments were donated to the Cross Foundation in 2020 and 2021 respectively.
PUMA SWOP Shops opened from July 9 to 11, 2021 and from July 15 to 17, 2021 in Hong Kong to promote “recycle and reuse”, earth lovers and fashionistas were invited to grant their sport style garment a second life by donating them at PUMA SWOP SHOP, while swapping for the same number of clothes items or accessories. 555 kg of garments were donated to the Cross Foundation.
During 2021 we developed a take back scheme for Ecom, complementing our existing takeback pilot scheme in Hong Kong. Our colleagues at PUMA North America continued to work with Soles for Souls and collected 522kg of used shoes, an initiative where shoes can be donated for reuse in support of a charitable cause.
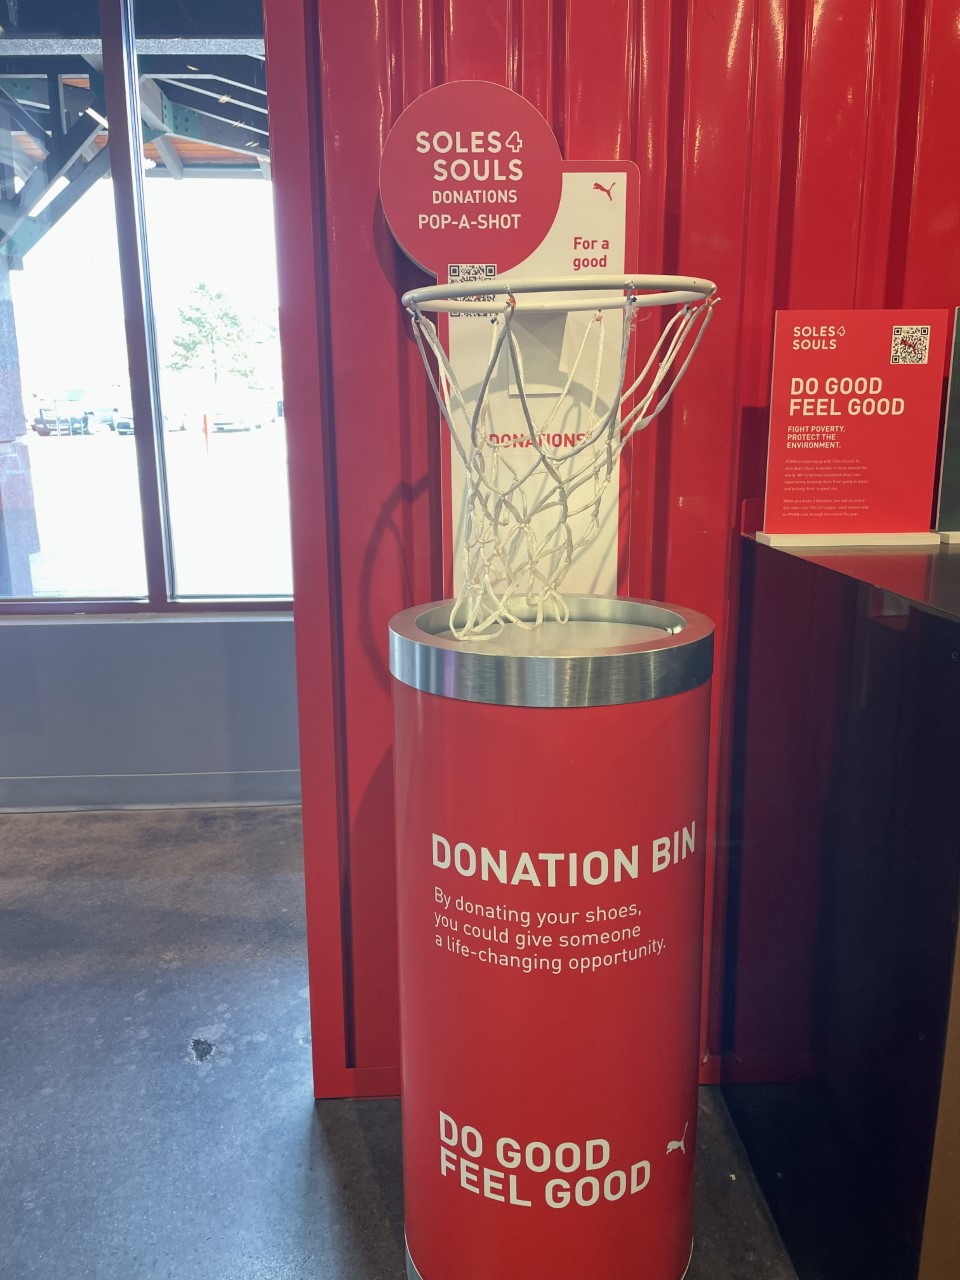 Soles 4 Souls takeback bin in the USA
In 2021 we developed a waste reduction roadmap and conducted a risk assessment.
The waste data published in our report cover both material waste and factory & office operation waste: cardboard, paper, plastic, light bulbs etc., to ensure a comprehensive scope to cover the waste generated on production sites. We see plastic, chemical, oil lubricant waste and e-waste as high risk. To prioritize these risks, we engaged with other brands and INSEE (a cement company that offers waste treatment services using co-processing technology in Vietnam, Cambodia, Bangladesh & Indonesia). To prioritize our actions we analyzed waste data collected in 2020 and the Higg FEM waste management score of our core factories.
Below are key focus areas for the coming years. Some actions were taken in 2021 and are reported in this report.
Target description:
Relates to United Nations Sustainable Development Goal 12
KPIs:
The PUMA Environmental Profit and Loss Account (EP&L) attributes more than 50% of our environmental impact to material and raw material production. Against this background we have decided to prioritize the large-scale use of more sustainable raw materials. In our 10FOR25 strategy we have set 100% targets for more sustainable raw materials such as cotton, polyester, leather and cardboard.
In addition to measuring the use of more sustainable materials, we now also determine the percentage of more sustainable products, that is, products made with a significant proportion of more sustainable materials. As defined in our PUMA Sustainability Index, or S-Index, more sustainable Apparel or Accessories products contain at least 50% more sustainable materials by weight. For Footwear we currently measure sustainability by including one or more main components made from more sustainable materials.
During 2021 we developed and rolled out an E-Learning toolkit on more sustainable products and our PUMA S-Index for the PUMA family. The training allows designers, developers and product managers to understand which materials qualify as more sustainable, how the PUMA S-Index is calculated, and which certifications need to be in place to externally communicate on product level. The training was completed by over 1,000 PUMA colleagues in 2021.
|
Product Category |
Styles 2021 |
Volume 2021 |
Volume 2020 |
Target 2025 |
|
Apparel with at least 50% more sustainable material |
67% |
79% * |
81% |
90% |
|
Accessories with at least 50% more sustainable material |
30% |
60%* |
47% |
90% |
|
Footwear with at least one more sustainable component |
52% |
46% |
24% |
90% |
|
TOTAL |
58% |
64% |
|
90% |
|
Number of Vegan Styles |
29 styles |
|
16 styles |
|
|
|
|
|
|
|
* In 2021 we implemented a calculation of 50% more sustainable material by weight, which is stricter than the calculation used in 2020.
Our long-term efforts to scale up more sustainable materials in partnership with our material suppliers have helped us to increase the use of more sustainable material. With 99% more sustainable cotton, 80% polyester, 99.9% leather, 100% certified accross all product divisions (Apparel, Footwear and Accessories), we are coming close to achieving our targets of 100% more sustainable materials for all these categories.
In 2021 we used 94% more sustainable cotton and 37% more sustainable polyester for our Footwear, which is a significant increase compared with 2020. This explains why the volume of more sustainable Footwear products has almost doubled since 2020.
To respond to an increased demand of our consumers, in 2021 we also offered 29 vegan certified styles, after 16 styles in 2020.
In 2021 we successfully launched multiple more sustainable collections such the EXHALE yoga collection co-created with Cara Delevingne which uses recycled polyester and natural dyes, and offsets the carbon footprint and the RE.GEN collection made from regenerated materials from our own industry waste. Other highlights include our new BETTER FOAM in Footwear, a material partly made from sugarcane. We also officially announced the launch of the RE:SUEDE, an experimental version of our most iconic sneaker, the SUEDE, to test for a biodegradable product and expanded our PUMA x FIRST MILE collection with products made from recycled polyester to further business units.
 PUMA Exhale collection
In light of enhancing the sustainability performance of our products, we have decided to undertake Life Cycle Assessments (LCA) of our top product portfolios. Outcomes of an LCA act as a quantifiable measure of our efforts towards a safer, cleaner and more sustainable value chain. LCAs also encourage innovation.
This year we have completed a screening LCA study for three of our best selling products (Footwear products such as Lifestyle shoes, performance shoes and Apparel products such as Cotton Pants) to map their environmental footprint on greenhouse gases and water consumption across their entire value chains (cradle to grave) as per ISO 14040 and 14044 standards.
Sphera, a leading consulting organization in the LCA domain, has conducted these Life Cycle Assessments, including all elements of these product life cycles, from the overall manufacturing including supply of material and energy carriers to the end of life. The data and methodology was peer-reviewed by an external expert.
The products studied are:
 Performance shoes - Velocity Nitro net weight 0.72 kg
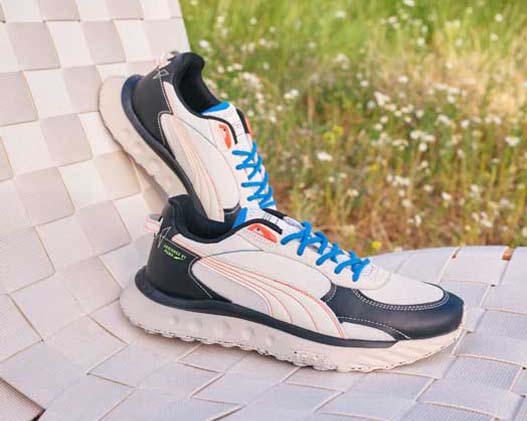
 Lifestyle shoes - Future Rider Play on net weight 0.78 kg
 Apparel pants - Modern Basic Pants (66% BCI cotton/34%polyester) with 30 wash cycles net weight 0.68 kg
Results of the analysis can be summarized as follows:
For performance shoes the global warming potential (GWP) (kg CO2e) has been influenced by materials which include base material, midsole, outsole, etc. (38.9%) and manufacturing energy (54.4%). While for lifestyle shoes, global warming potential (kg CO2e) has been influenced by materials by 58% and manufacturing energy by 35.1%. The lifestyle shoes are made of leather, which explains why the global warming potential for material is 58%. Leather in the lifestyle shoes has a higher contribution than other materials. EVA, polyester, hotmelt glue and glue adhesives have high contributions in both Footwear styles.
Energy impact is lower in the case of lifestyle shoes (3.3 kg CO2), whereas performance shoes have a higher impact (4.14 kg CO2) mainly because the data is considered for the whole factory that produces the performance shoes (not specifically for the product as such). We see opportunities to improve manufacturing energy efficiency in the factory in question.
Materials, adhesive and water used for production as well as packaging all together have a significant global warming potential for both Footwear styles (38.9% for performance shoes and 58% for lifestyle shoes).
For Apparel pants, global warming potential (kg CO2e) has been influenced by cotton farming (11%), yarn spinning (34%), dyeing and finishing (44%) and use stage (37%). Primary energy* demand has major contributions from cotton farming (23%), yarn spinning (37%), dyeing and fabric finishing (28%) and use stage (35%). Blue water** consumption has higher contributions from cotton (91%) than other materials such as polyester, chemicals (13%), electricity and fuel (4%).
Footwear products usually don’t require extensive cleaning during their lifetime, and hence the impact of the use phase is negligible. Therefore the GHG emission of use phase from Footwear is not considered1. However, for Apparel products about ~37% GWP impact lies in the use phase where washing and drying are required and result in respective emissions from energy consumption.
End of life phase includes reuse, recycling, incineration and landfilling based on European scenarios, which contributes to about 2-7% in global warming potential (GWP) impacts.
1 Source: Quantis “Draft product environmental footprint category rules (PEFCR), Apparel and Footwear”
* Primary energy is the energy that is harvested directly from natural resources: coal, oil, natural gas and uranium.
** Blue water is water that has been sourced from surface or groundwater resources and is either evaporated or incorporated into a product.
Apparel and Footwear products supply chain is quite complex and vast, which involves multiple stages such as cultivation, processing, finishing, assembly, distribution, use and end of life. The LCA study is used as a lens to understand the value chain environmental impacts of our products.
PUMA now intends to use the outcomes of the study to increase internal awareness and improve the Product Environmental Footprint by increasing the use of more sustainable materials (recycled or biosynthetic), improving resource efficiency, optimizing energy use, promoting renewable energy in the value chain, and enhancing circularity of our products.
Mapping and assessing risk and impact practices in the lower tiers of the supply chain identify opportunities for improvement to be better integrated at the strategic level.
We have required our suppliers to source more sustainable cotton, grown in farms which are licensed or certified as having good farming and Human Rights standards, or recycled cotton. More than 90% of the cotton comes from the USA, Australia, India and Brazil.
In parallel, we work on improving the traceability of the leather we use via the traceability system of the Leather Working Group. The leather used in PUMA Footwear comes from the USA (47%), Argentina (15%), Australia (15%), Italy (8%), Brazil (2%), Uruguay (0.4%) and Paraguay (0.3%).
We monitor our LWG (Leather Working Group) medal rated tanneries' traceability performance. Most suede tanneries work with agents and intermediaries along with direct tanneries to guarantee a stable sourcing supply, suede being a byproduct of the full grain business. This creates a challenge to have full traceability. This explains why our suede leather LWG tanneries have a lower traceability performance than full grain LWG tanneries. We nevertheless aim to increase all our LWG medal rated tanneries’ traceability performance over time. We also keep track of the origin of the down and recycled polyester used in PUMA products. 97% of the down used in our products comes from China, 3% from Vietnam. 90% of our recycled polyester comes from Vietnam, China, Taiwan (China) and Korea.
Cotton & polyester including Apparel and Accessories material (excluding trims)
As in previous years, a significant percentage of our more sustainable materials can be attributed to cotton from the Better Cotton Initiative, bluesign® and/or OEKO-TEX®-certified polyester, and Leather Working Group (LWG)-certified tanneries. In addition, we only use down feathers certified by the Responsible Down Standard, and 38% of our viscose is made by the world’s leading viscose suppliers with proven track record on sustainability. Therefore more than 67% of our Apparel, 30% of Accessories and 52% of Footwear products are already classified as more sustainable products, in line with the definition in our PUMA Sustainability Index.
Coverage and calculation are more complex for Footwear because all our shoes are made from several components. As main materials we use polyester, polyurethane, rubber, leather and nylon. In line with our earlier targets, we have achieved 99.9% coverage of LWG-certified leather. For the other materials, in 2021 our sourcing teams worked to find more sustainable solutions that are also cost-efficient. For example, we now are using recycled materials for all our counters and many of our linings and have replaced the polyester-based backing of most polyurethane (PU) materials, which we use as an alternative to leather, with recycled polyester.
In 2021 we started reporting our material data including trims, such as threads, zippers, ribbons, interlining, etc. We see opportunities to increase the use of more sustainable material in trims in 2022, along with fabrics/materials. This explains why the percentage of more sustainable cotton for Apparel seems to decrease compared with 2020, but the use of more sustainable cotton in volume increased by around 45%. In our effort to improve our material data quality, this year we included material data for headwear (in addition to trims) under accessories. Fabric (99% of total volume) is made of more sustainable cotton, while trims are made with conventional cotton (1% of total volume). We used dope dye technology for the lining of our bags. Dope dye technology eliminates the need for the yarn dyeing process. In 2021 we conducted a Life Cycle Assessment on dope dyed polyester (as per international standards ISO 14040 and ISO14044) through a third party for the dyeing and finishing process, and we found: Energy saving: 29.69%, Water saving: 13.84%, Chemical use saving: 34.41%.
|
|
GHG |
Water Consumption difference (%) |
Cumulative Energy Demand difference (%) |
|
Raw material |
-0.72% |
-0.72% |
-0.72% |
|
Yarn processing |
-19.51% |
-0.58% |
-11.66% |
|
Weaving process |
-0.72% |
-0.72% |
-0.72% |
|
Dyeing and finishing process |
-29.37% |
-13.84% |
-29.69% |
|
Finishing process |
0.00% |
0.00% |
0.00% |
|
Final fabric packaging |
0.00% |
0.00% |
0.00% |
|
Final fabric transportation |
0.00% |
0.00% |
0.00% |
|
Total |
-9.22% |
-3.67% |
-6.89% |
|
|
|
|
|
In 2021 we used 94% more sustainable cotton and 37% more sustainable polyester for our Footwear, which is a significant increase compared with 2020, which explained why the volume of Footwear products with more sustainable material doubled.
In 2021 we included outer cardboard data into the Paper & Cardboard section below. Our focus remains on increasing Paper & Cardboard FSC certified or recycled.
We hardly used wool throughout 2021, thus we have not yet initiated responsible wool standards, but we still aim to reach 100% certified wool in 2025.
|
|
Apparel |
Accessories |
Footwear |
Total |
|
Cotton |
|
|
|
|
|
Conventional |
1% |
0.7% |
6% |
1.2% |
|
Recycled |
2.3% |
|
4% |
2.3% |
|
Better Cotton |
96.7% |
99.3% |
90% |
96.4% |
|
|
|
|
|
|
|
Polyester |
|
|
|
|
|
Conventional |
1% |
|
63% |
20% |
|
Dope dye |
|
23% |
|
2% |
|
Recycled |
55% |
6% |
32% |
43% |
|
Bluesign |
21% |
28% |
|
15% |
|
Oekotex |
22% |
42% |
5% |
19% |
|
|
|
|
|
|
|
Manmade Cellulosics |
|
|
|
|
|
Green-shirt rated fiber producers** |
38% |
|
|
38% |
|
Conventional |
62% |
|
|
62% |
|
|
|
|
|
|
|
Polyamide (nylon) |
|
|
|
|
|
Conventional |
15.3% |
85.5% |
97.4% |
74.1% |
|
Bluesign |
60.3% |
|
2.5% |
18.4% |
|
Recycled |
24.4% |
14.5% |
0.1% |
7.5% |
|
|
|
|
|
|
|
Leather |
|
|
|
|
|
Conventional |
|
|
|
0.1% |
|
LWG medal rated tannery |
|
|
99.9% |
99.9% |
|
Recycled |
|
|
0.03% |
0.03% |
|
|
|
|
|
|
|
Rubber |
|
|
|
|
|
Synthetic |
|
|
69% |
69% |
|
Natural |
|
|
31% |
31% |
|
|
|
|
|
|
|
PU |
|
|
|
|
|
Conventional |
100% |
100% |
99% |
99% |
|
Water-based |
|
|
1% |
1% |
|
|
|
|
|
|
|
Down |
|
|
|
|
|
Certified RDS |
100% |
|
|
100% |
|
|
|
|
|
|
* Figures including trims and excluding licensee production
** Green shirt rated fiber producers, as set by the annual Canopy Hot Button report, encourage existing fiber suppliers to commit to CanopyStyle and a Canopy Audit https://hotbutton.canopyplanet.org/.
|
|
2021* |
2020 |
2019 |
2025 target |
|
Apparel |
|
|
|
|
|
More sustainable cotton |
99% |
100% |
82% |
100% |
|
More sustainable polyester |
99% |
99.5% |
98% |
100% |
|
|
|
|
|
|
|
Accessories |
|
|
|
|
|
More sustainable cotton |
99% |
100% |
|
100% |
|
More sustainable polyester |
100% |
100% |
100% |
100% |
|
|
|
|
|
|
|
Footwear |
|
|
|
|
|
More sustainable cotton |
94% |
0.18% |
|
100% |
|
More sustainable polyester |
37% |
12.1% |
6% |
100% |
|
More sustainable leather |
99.9% |
97.9% |
|
NA |
|
More sustainable PU |
1% |
|
|
NA |
|
|
|
|
|
|
|
L&P paper/cardboard products |
|
|
|
|
|
Recycled and/or FSC certified |
88%** |
99% |
98.9% |
100% |
* 2021 figures including trims and excluding licensee production – 2020 figures excluding trims and licensee production
** Including outer cardboard boxes, which were excluded in previous years.
|
Number of factories certified |
GRS/RCS |
GOTS |
OCS |
RDS |
LWG |
|
Apparel & Accessories T1 & T2 |
63 |
21 |
6 |
6 |
NA |
|
Footwear T1 & T2 |
15 |
|
|
NA |
NA |
|
Leather Tanneries |
|
|
|
|
27 gold |
We are working to complete the GRS/RCS certification of our T1 Footwear factories and Footwear T2 manufacturers of insole, outsole or midsole.
Target description:
Relates to United Nations Sustainable Development Goals 14 and 15
|
Sub-targets |
2021* |
2020 |
Target 2025 |
|
Science Based Target (SBT) |
Not started |
Joined Fashion Pact activities on biodiversity |
SBT set |
|
Cotton (BCI** and/or recycled) |
99% |
100% |
100% |
|
Leather (LWG-certified tanneries) |
99.9% |
98% |
100% |
|
Down (RDS-certified) |
100% |
100% |
100% |
|
Sustainably sourced viscose / MMCF |
38% |
100% |
100% |
|
Cardboard and paper (FSC and/or recycled) |
88%*** |
99% (product packaging supply chain) |
100% |
|
Number of vegan styles |
29 |
16 |
NA |
|
|
|
|
|
* Including trims and excluding licensee production
** Better Cotton Initiative (BCI) principle: Biodiversity and Land Use is one of the seven Better Cotton Principles and Criteria. Management practices address identifying and mapping biodiversity resources, identifying and restoring degraded areas, enhancing populations of beneficial insects, ensuring crop rotation and protecting riparian areas. https://bettercotton.org/wp-content/uploads/2019/06/Better-Cotton-Principles-Criteria-V2.1.pdf
*** Including outer cardboard
Scientific reports point to the fact that the loss of biodiversity has increased over the last decade. Once extinct, species can never be brought back and are lost forever. Not only because our logo features a wild animal, but we have also decided to dedicate one of our 10FOR25 targets to biodiversity.
PUMA is a signatory of the Fashion Pact, a global coalition of companies in the fashion and textile industry (ready-to-wear, sport, lifestyle and luxury) including their suppliers and distributors, all committed to a common core of key environmental goals in three areas: stopping global warming, restoring biodiversity and protecting the oceans.
Our biodiversity blueprints are described below:
Biodiversity loss and climate change are interdependent and mutually reinforcing. For example, protecting forests could help reduce greenhouse gas emissions. In turn, the rise of global temperatures increases the risk of species extinction. In 2019 PUMA published its science-based emission target (SBT) with the SBT Coalition and joined the Fashion Pact. PUMA climate action and progress are reported in the Climate section of this report.
Most of the negative impact on biodiversity comes from three stages in the value chain: raw material production, material preparation and processing, and end of life.
To mitigate the risk of biodiversity loss due to the production process, we address environmental pollution risk through our targets and suppliers’ program on Climate, Chemicals, Water and Air.
In 2021 we developed roadmaps for water and waste, which can be found in Water and Air, Plastic and Ocean sections of this report.
100% of our transit packaging is made of recycled plastic, we work on eliminating plastic product primary packaging and plastic shopping bags. Our targets and progress are described in the Plastic and Ocean section of this report.
We use approximately 50,000 tons of cotton and 4,300 tons of leather per year for our products. Both cotton farming and cattle ranching require extensive land use and have been cited to reduce biodiversity. 99% of cotton used in PUMA products are BCI or recycled. 99% of the leather used in our footwears are sourced from LWG rated tanneries. Leather traceability is a first step towards reduced deforestation. We monitor our LWG (Leather Working Group) medal rated tanneries' traceability performance.
In addition, our annual paper and cardboard consumption amounts to 19,500 tons (shoebox, hangtags and outer cardboard). As of end of 2021, 88% are FSC certified or recycled. In 2021 we engaged with Canopy, a Canadian non-profit organization with a mission to protect the world’s forests, species and climate, and to help advance indigenous communities’ rights. They helped us to develop our policy on forest protection. We engaged in Canopy‘s initiatives: CanopyStyle and Pack4good; through these initiatives we started investigating into next generation raw materials with a focus on biobased material, such as wheat, as a partial substitute for paper in our shopping paper bags.
In addition, in 2020 we mapped out our viscose supply chain with the goal of procuring 100% of our viscose from suppliers committed to reducing the risk of sourcing from ancient and endangered forests. In June, PUMA formally joined the CanopyStyle initiative to support this goal. In 2021, 38% of viscose was sourced from Canopy’s 2021 Hot Button Report green-shirt rated suppliers; we prioritized sourcing new fabrics containing viscose to replace polyester in our Apparel products. To implement our new strategy, we used not only fabrics from green-shirt rated viscose, but also old carry-over fabrics developed over the past 5-10 years. The volume of viscose used in 2021 is 4 times higher than in 2020. In 2022 we aim at only sourcing green-shirt rated viscose as per our Biodiversity and Forest protection policy launched in April 2021 and also to prefer viscose made from recycled textiles.
We hardly used wool throughout 2021, thus we have not yet initiated Responsible Wool Standards, but we still aim to reach 100% certified wool in 2025.
In 2021 we published the PUMA biodiversity policy and animal welfare policy, to create a framework on our approach related to biodiversity and animal welfare. These policies are published on our website.
As part of the Fashion Pact, we commit to support the development of science-based targets on biodiversity.
To help the protection of endangered forests and species, PUMA commits not to use any wood or wood-derived fabrics made from ancient and endangered forests.
At PUMA we care for the welfare of animals. We do not accept the use of animal products which originate from animals which have been inhumanely treated. Therefore we aim at implementing high welfare and traceability standards. PUMA consults on a regular basis with animal protection organizations to review our policy and actions.
“We are delighted to have PUMA as part of our CanopyStyle and Pack4Good initiatives to end sourcing from ancient and endangered forests. Keeping forests standing is 30% of the climate solution, and PUMA – a company named after a majestic forest creature – is showing leadership on their behalf. We look forward to working with the PUMA team to get them to 100% green shirts, accelerate production of circular alternatives and secure ambitious levels of forest conservation.”
NICOLE RYCROFT
Canopy’s Founder and Executive Director, Canopy
During 2021 we revisited the methodology of our PUMA Environmental Profit and Loss Account, or EP&L.
The methodology, which was developed in 2011 by PWC and Truecost, and later further refined by Kering with the help of PWC, mainly relies on material input and spend data.
During our review, we realized that many savings made by our Tier 1 and Tier 2 suppliers had not been captured by the EP&L methodology, and for some of our major materials used, such as BCI Cotton, no specific EP&L emission factors have been developed.
Therefore we decided to pause the publication of our EP&L for 2021 and rework the methodology to more accurately reflect our environmental performance in the future.
As in previous years, we are reporting the underlying datasets as Environmental Key Performance Indicators in this chapter.
|
Paper |
2021 |
2020 |
2019 |
2018 |
2017 |
% Change 2020/2021 |
% Change 2017/2021 |
|
PUMA own entities |
|
|
|
|
|
|
|
|
Paper and cardboard consumption (tons)* |
4,152 |
2,638 |
2,281 |
2,292 |
2,756 |
57% |
51% |
|
3,306 |
1,848 |
1,818 |
1,120 |
2,025 |
79% |
63% |
|
|
79.6% |
70% |
80% |
49% |
74% |
|
|
|
|
PUMA production |
|
|
|
|
|
|
|
|
Paper and cardboard consumption from PUMA production (shoe boxes, hangtags) (tons) |
19,670** |
18,538 |
14,863 |
13,607 |
14,129 |
25% |
31% |
|
88%** |
99% |
100% |
98% |
n/a |
|
|
|
|
|
|
|
|
|
|
|
|
|
* Including paper bags, office paper and cardboard consumption of offices, warehouses and stores ** Including outer cardboard boxes 1. Figures include PUMA-owned or operated offices, warehouses and stores. Includes our own production sites in Argentina. All other production is outsourced to independent supplier factories, some warehouse operations are outsourced to independent logistic providers. Franchised stores are excluded. 2. Data includes extrapolations or estimates where no real data could be provided. 3. Methodological changes over the last three years have influenced results. |
|||||||
|
Energy |
2021 |
2020 |
2019 |
2018 |
2017 |
% Change 2020/2021 |
% Change 2017/2021 |
|
PUMA own entities |
|
|
|
|
|
|
|
|
0 |
0 |
12,683 |
29,766 |
52,508 |
- |
-100% |
|
|
13,749 |
10,839 |
11,547 |
11,695 |
11,611 |
27% |
18% |
|
|
54,117 |
50,526 |
37,269 |
25,051 |
0 |
7% |
n/a |
|
|
Total electricity consumption (MWh) |
67,866 |
61,365 |
61,499 |
66,512 |
64,119 |
11% |
6% |
|
20% |
18% |
16% |
15% |
18% |
|
|
|
|
100% |
100% |
79% |
55% |
18% |
|
|
|
|
Energy from non-renewable fuels (oil, natural gas, etc.) (MWh) |
10,006 |
10,739 |
10,975 |
11,724 |
14,430 |
-7% |
-31% |
|
Energy from district heating (MWh) |
10,795 |
6,247 |
7,915 |
5,734 |
5,155 |
73% |
109% |
|
Total energy consumption (MWh) |
88,666 |
78,350 |
80,389 |
83,970 |
83,704 |
13% |
6% |
|
PUMA production (Tier 1)* |
|
|
|
|
|
|
|
|
Non-renewable energy consumption (MWh) |
331,199 |
221,641 |
246,160 |
195,866 |
194,881 |
52% |
67% |
|
Renewable energy consumption (MWh) |
17,763 |
3013 |
|
|
294 |
492% |
5950% |
|
5% |
1% |
|
|
0.1% |
400% |
4900% |
|
|
PUMA production (Core Tier 2)** |
|
|
|
|
|
|
|
|
Non-renewable energy consumption (MWh) |
795,673 |
607,310 |
|
|
586,986 |
31% |
36% |
|
Renewable energy consumption (MWh) |
39,317 |
3,393 |
|
|
524 |
1059% |
7399% |
|
5% |
0.6% |
|
|
0.1% |
233% |
4900% |
|
|
|
|
|
|
|
|
|
|
|
* Includes Tier 1 suppliers, Apparel, Footwear and Accessories (181 factories) ** Includes Core Tier 2 suppliers, leather, synthetic and textile (43 factories) 1. Figures include PUMA-owned or operated offices, warehouses and stores. Includes our own production sites in Argentina. All other production is outsourced to independent supplier factories, some warehouse operations are outsourced to independent logistic providers. Franchised stores are excluded. 2. Data includes extrapolations or estimates where no real data could be provided. 3. Methodological changes over the last three years have influenced results. |
|||||||
|
Waste & Water |
2021 |
2020 |
2019 |
2018 |
2017 |
% Change 2020/2021 |
% Change 2017/2021 |
|
PUMA own entities |
|
|
|
|
|
|
|
|
Total waste (tons) |
5,215 |
3,949* |
3,644* |
4,877 |
5,293 |
32% |
-1% |
|
2,220 |
1,436* |
1,603* |
2,282 |
3,419 |
55% |
-35% |
|
|
43% |
36% |
44% |
47% |
65% |
|
|
|
|
Water PUMA own entities (m3) |
116,829 |
96,569 |
89,676 |
95,291 |
106,397 |
21% |
10% |
|
PUMA production (Tier 1) ** |
|
|
|
|
|
|
|
|
Total waste (tons) |
33,806 |
23,498 |
24,205 |
16,682 |
14,686 |
44% |
130% |
|
10% |
9% |
|
|
|
11% |
|
|
|
Water consumption (k m3) |
2,706 |
2,332 |
2,572 |
2,030 |
2,149 |
16% |
26% |
|
PUMA production (Core Tier 2)*** |
|
|
|
|
|
|
|
|
Total waste (tons) |
8,689 |
5,968 |
|
|
|
46% |
|
|
Percentage production waste to landfill (%) |
9% |
18% |
|
|
|
50% |
|
|
Water consumption (k m3) |
5,769 |
4,796 |
|
|
|
20% |
|
|
|
|
|
|
|
|
|
|
|
* Waste data for PUMA’s own entities in 2019 and 2020 restated due to an underreporting in those years. ** Includes Tier 1 suppliers, Apparel, Footwear and Accessories (181 factories) *** Includes Core Tier 2 suppliers, leather, synthetic and textile (43 factories)
|
|||||||
As we can see from T.29, our own waste creation and water consumption increased, over the last years. This increase can partially be attributed to our increased sales volume, as waste creation in our stores in directly linked to sales turnover, with the main waste created from shoeboxes or apparel packaging. We will take those increases as an opportunity to focus on our own entities waste and water performance as well within the next three years.
We continue to work with our core suppliers to reduce their environmental footprint. In 2021 we continued the cooperation with the Apparel Impact Institute’s Clean by Design Program and with the International Finance Corporation’s PaCT Project on resource efficiency and renewable energy in Bangladesh. We also continue to joint forces with the German Development Agency, GIZ, to conduct solar photovoltaic feasibility studies at 22 suppliers across Asia. We have developed an internal training module on climate change for our internal stakeholders (branch managers and production teams) to provide them a clearer idea about our targets and our requirement for suppliers, so that they would be able to better support us when we work with suppliers on climate change topics.
We also prepared an e-learning module for other colleagues who are interested in knowing more about our targets and our work on carbon footprint reduction. This e-learning module will be completed and made available online in 2022.
For our suppliers’ engagement we created an in-house tool to guide core suppliers to set up their climate change target following different ambition levels (their own SBTs or at least as ambitious as the one PUMA set for supply chain). A training workshop that will be conducted in 2022 February to give instructions for suppliers on how to better use this target setting tool.
There is an overall trend of carbon emission reduction (within our Core Tier 1 suppliers) per pair of footwear (-32%) or piece of apparel product (-34%) since 2017, as an outcome of our core factories which joined cleaner production and renewable energy projects promoted by PUMA. During the same period, our Core Tier 1 suppliers have been able to reduce the amount of water per piece of apparel significantly by 44%, due to actions taken by our core factories in water efficiency with the cleaner production program, while water consumption at Tier 1 Footwear suppliers increased by 18%.
Apparel and Footwear suppliers reported an increase in production waste of 34% and 30% respectively since 2017. Since we launched our goals in 2020 to reduce production waste to landfill by 50% by 2025, we have worked on securing the data quality to secure our baseline. The waste data published in this report cover both material waste and factory & office operation waste: cardboard, paper, plastic, light bulbs etc., to ensure a comprehensive scope covered for the waste generated on production sites. This is an increased scope compared to the measure for capturing the waste data in 2017, which partially explains the increase. We also added 10 new core factories for Apparel, which have not yet been engaged in cleaner production programs. For Footwear we increased the number of more complicated styles, which implies that the number of components and overlays has increased. The more components and overlays we have, the more waste is generated. The list of core factories for Footwear was stable between 2020 and 2021, which explains why Footwear factories decreased their waste per pair by 3%, while Apparel factories increased their waste per piece by 15%.
Most of our Tier 1 production waste is recycled, with only 4% of waste ending up in landfills for Apparel suppliers and 14% for Footwear suppliers.
|
Summary of supplier e-KPIs |
|
Weights |
Change |
|
||||
|
Value |
2021 |
2020 |
2019 |
2018 |
2017 |
2020-2021 |
2017-2021 |
Number of Suppliers |
|
Energy/pair (kWh) |
1.41 |
1.31 |
1.30 |
1.25 |
1.40 |
8% |
1% |
21 |
|
CO2/pair (kg) |
0.68 |
0.74 |
0.96 |
0.93 |
1.00 |
-8% |
-32% |
21 |
|
Water/pair (l) |
11.95 |
15.08 |
15.21 |
12.30 |
14.50 |
-21% |
-18% |
21 |
|
Waste/pair (g) |
140.88 |
144.80 |
126.66 |
108.51 |
115.90 |
-3% |
22% |
21 |
|
Waste to landfills/pair (g) |
19 |
24 |
|
|
|
-19% |
|
|
|
Summary of supplier e-KPIs |
|
Weights |
Change |
|
||||
|
Value |
2021 |
2020 |
2019 |
2018 |
2017 |
2020-2021 |
2017-2021 |
Number of Suppliers |
|
Energy/piece (kWh) |
0.55 |
0.56 |
0.57 |
0.57 |
0.72 |
-1% |
-24% |
26 |
|
CO2/piece (kg) |
0.20 |
0.22 |
0.24 |
0.26 |
0.31 |
-9% |
-34% |
26 |
|
Water/piece (l) |
4.23 |
4.60 |
4.39 |
4.20 |
7.58 |
-8% |
-44% |
26 |
|
Waste/piece (g) |
62.33 |
54.27 |
56.33 |
46.50 |
44.00 |
15% |
42% |
26 |
|
Waste to landfills/piece (g) |
2.4 |
2.6 |
|
|
|
-9% |
|
|
Since 2017 we have also been measuring average environmental key performance indicators (E-KPIs) from textile and leather manufacturing. We have included our main material suppliers in our energy and water efficiency programs and other brands also have expanded their cleaner production programs to include our shared material suppliers. Some of the CO2 emissions reductions can be attributed to coal and oil for boilers being replaced with less polluting fuel sources such as biomass fuel.
The CO2 emissions indicator for textile supply chain in 2021 when compared to 2017 is observed with a 3% increase, not in line with our expectations. This is mainly because of our textile strategy: 14 new core factories were added, for which we had not engaged in a cleaner production program. When we compare improvement in carbon efficiency like-for-like with the 19 suppliers which were core factories for PUMA in 2020 and 2021 we record a 7% reduction in their carbon footprints per unit of textile produced for PUMA in 2021.
|
Summary of supplier e-KPIs |
|
Weights |
Change |
|
||||
|
Value |
2021 |
2020 |
2019 |
2018 |
2017 |
2020-2021 |
2017-2021 |
Number of factories |
|
Energy/m2 (kWh) |
6.5 |
7.0 |
8.2 |
8.7 |
9.1 |
-8% |
-29% |
6 |
|
CO2/m2 (kg) |
1.9 |
2.7 |
3.2 |
3.2 |
3.4 |
-30% |
-44% |
6 |
|
Water/m2 (l) |
60.9 |
68.3 |
74.7 |
90.2 |
91.8 |
-11% |
-34% |
6 |
|
Waste/m2 (kg) |
0.5 |
0.7 |
0.8 |
0.8 |
1.6 |
-32% |
-70% |
6 |
|
Summary of supplier e-KPIs |
|
Weights |
Change |
|
||||
|
Value |
2021 |
2020 |
2019 |
2018 |
2017 |
2020-2021 |
2017-2021 |
Number of factories |
|
Energy/t (kWh) |
13,393.6 |
13,049.1 |
12,636.3 |
13,386.80 |
13,679.11 |
3% |
-2% |
32 |
|
CO2/t (t) |
4.58 |
4.47 |
4.37 |
4.45 |
4.45 |
3% |
3% |
32 |
|
Water/t (m3) |
98.7 |
103.4 |
105.5 |
122.78 |
119.30 |
-4% |
-17% |
32 |
|
Waste/t (kg) |
121.38 |
78.9 |
62.08 |
70.63 |
299.59 |
54% |
-59% |
32 |
Taxonomy objectives
The Taxonomy Regulation (EU) 2020/852 (in the following “Taxonomy”) entered into force on 22 June 2020. The purpose of this new regulation is to provide a definition of what constitutes a sustainable economic activity and to redirect capital flows into companies who are aligning their business models on such sustainable economic activities. The focus of the Taxonomy lies on 6 environmental objectives:
The Taxonomy has identified eligible economic activities that substantially contribute to each of these environmental objectives. Linked to these eligible activities are technical screening criteria that define whether the activity is considered sustainable or not (aligned).
The first two Delegated Acts on the climate objectives (climate change mitigation (Annex I) and climate change adaptation (Annex II)) (in the following “Climate Delegated Act”), was published in the Official Journal on December 9, 2021 and entered into force on January 1, 2022 ((EU) 2021/2139). Further delegated acts for the remaining objectives will be published in 2022.
New disclosure requirements for non-financial undertakings
According to Articles 2 Climate Delegated Act and 8 of the Taxonomy Directive EU2020/852 any undertaking subject to the Non-Financial Reporting Directive (NFRD) must provide information on “environmentally sustainable” revenues, investments (capital expenditure) and operating expenses (opex).
According to Article 10 of the Climate Delegated Act of the Taxonomy Directive EU2020/852 from January 1, 2022 until December 31, 2022, non-financial undertakings shall only disclose the proportion of Taxonomy-eligible and Taxonomy non-eligible economic activities in their total turnover, capital and operational expenditure. Eligibility of activities implies that an activity is included in the Climate Delegated Act. Whether an activity is Taxonomy-eligible or not says nothing about the (un)sustainability of that activity. Being Taxonomy-eligible is merely an indication that a certain activity makes a substantial contribution to one of the six environmental objectives of the Taxonomy.
Taxonomy-eligibility of PUMA’s sales in respect of climate change mitigation and climate change adaptation
The technical screening criteria in Annex I and Annex II of the Delegated Regulation (EU) 2021/2139 as of June 4, 2021 for the first two environmental objectives, namely climate change mitigation and climate change adaptation, do not list any business activities that are linked to the production and sale of Footwear, Apparel and Accessories. This means that PUMA’s business activities related to sales are not included in the Climate Delegated Act. This is not surprising due to the fact that currently the EU has prioritized economic activities that can make the most relevant contribution to the two environmental objectives of climate adaptation and mitigation. Therefore PUMA’s business activities in this regard are not considered Taxonomy-eligible (so far).
Eligible capital expenditure
PUMA understands the Taxonomy and the Delegated Act to Article 8 of the Taxonomy Directive nonetheless require non-financial undertakings with Taxonomy non-eligible sales activities to report on the part of the capital expenditure related to the purchase of output from taxonomy-aligned economic activities and individual measures enabling the target activities to become low-carbon or to lead to greenhouse gas reductions.
In this regard PUMA reviewed the so-called cross-cutting activities that are not directly related to PUMA’s primary business activity and are not revenue-generating for PUMA, but still are relevant to support PUMA’s sustainability efforts. Taxonomy-eligible capital expenditure could be identified in regard to “Transport” and “Real Estate Activities”.
In 2021 PUMA started operations in several newly rented buildings with high requirements on energy-efficiency, such as, for example:
As part of PUMA’s 10FOR25 sustainability targets, PUMA is transitioning its car fleet to more sustainable transport vehicles. Therefore in 2021 PUMA invested in the lease of a number of low or zero emission vehicles.
The total capital expenditure as defined by the taxonomy (IAS 16, 38 and IFRS 16) of the PUMA Group amounts to 449,445 TEUR for the financial year 2021. The eligible capital expenditure as definded by the taxonomy regarding “Transport” and “Real Estate Activities” amounts to 244,023 TEUR.
Eligible operational expenditure
PUMA understands the Taxonomy and the Delegated Act to Article 8 of the Taxonomy Directive including its Annexes to nonetheless require non-financial undertakings with Taxonomy non-eligible activities to report on the part of the operational expenditure related to the purchase of output from taxonomy-aligned economic activities and individual measures enabling the target activities to become low-carbon or to lead to greenhouse gas reductions.
Due to the nature of our business model, which is the design, development, marketing and sale of Footwear, Apparel and Accessories, the eligible operational expenditure is not material in the context of the first two environmental objectives of the Taxonomy, therefore we report the numerator of our taxonomy eligible operational expenditure as zero.
For the denominator, Article 2, Annex 1 Section 1.1.3.1. of the Climate Delegated Act requires reporting on the total operational expenditure derived from the categories “research and development, building renovation measures, short-term lease, maintenance and repair and any other direct expenditures related to the day-to-day servicing of assets of property, plant and equipment by the undertaking or third party to whom activities are outsourced that are necessary to ensure the continued and effective functioning of such assets”. The total operational expenditure from these categories amounts to 78 TEUR for the financial year 2021.
Outlook
PUMA expects that its business activities will be defined to contribute significantly to the “Transition to a circular economy” objective. Therefore we anticipate a more detailed Taxonomy reporting for 2022.