Results of operations
2023 | 2022 | ||||
€ million | % | € million | % | +/-% | |
Sales | 8,601.7 | 100.0% | 8,465.1 | 100.0% | 1.6% |
Cost of sales | -4,615.1 | -53.7% | -4,562.3 | -53.9% | 1.2% |
Gross profit | 3,986.6 | 46.3% | 3,902.7 | 46.1% | 2.1% |
Royalty and commission income | 38.5 | 0.4% | 33.8 | 0.4% | 14.0% |
Other operating income and expenses | -3,403.5 | -39.6% | -3,295.9 | -38.9% | 3.3% |
Operating Result (EBIT) | 621.6 | 7.2% | 640.6 | 7.6% | -3.0% |
Financial result | -143.3 | -1.7% | -88.9 | -1.1% | 61.2% |
Earnings before taxes (EBT) | 478.3 | 5.6% | 551.7 | 6.5% | -13.3% |
Taxes on income | -117.8 | -1.4% | -127.4 | -1.5% | -7.5% |
- Tax rate | 24.6% | 23.1% | |||
Net income attributable to non-controlling interests | -55.7 | -0.6% | -70.9 | -0.8% | -21.4% |
Net income | 304.9 | 3.5% | 353.5 | 4.2% | -13.7% |
Weighted average number of outstanding shares (million shares) | 149.85 | 149.65 | 0.1% | ||
Weighted average number of outstanding shares, diluted (million shares) | 149.87 | 149.66 | 0.1% | ||
Earnings per share (€) | 2.03 | 2.36 | -14.0% | ||
Earnings per share (€) - diluted | 2.03 | 2.36 | -14.0% | ||
|
|
|
|
|
|
Illustration of earnings development in 2023 compared to the outlook
In the outlook in the combined management report for 2022, PUMA forecast an operating result (EBIT) in the range between € 590 million and € 670 million for the financial year 2023 (2022: € 641 million). Thanks to continued strong brand momentum, exciting product launches, strong partnerships along the value chain, and supported by our operational flexibility, PUMA was able to fully achieve its forecast for operating result for the full-year 2023, despite the significant devaluation of the Argentine peso.
More details on earnings development in the financial year under review are provided below.
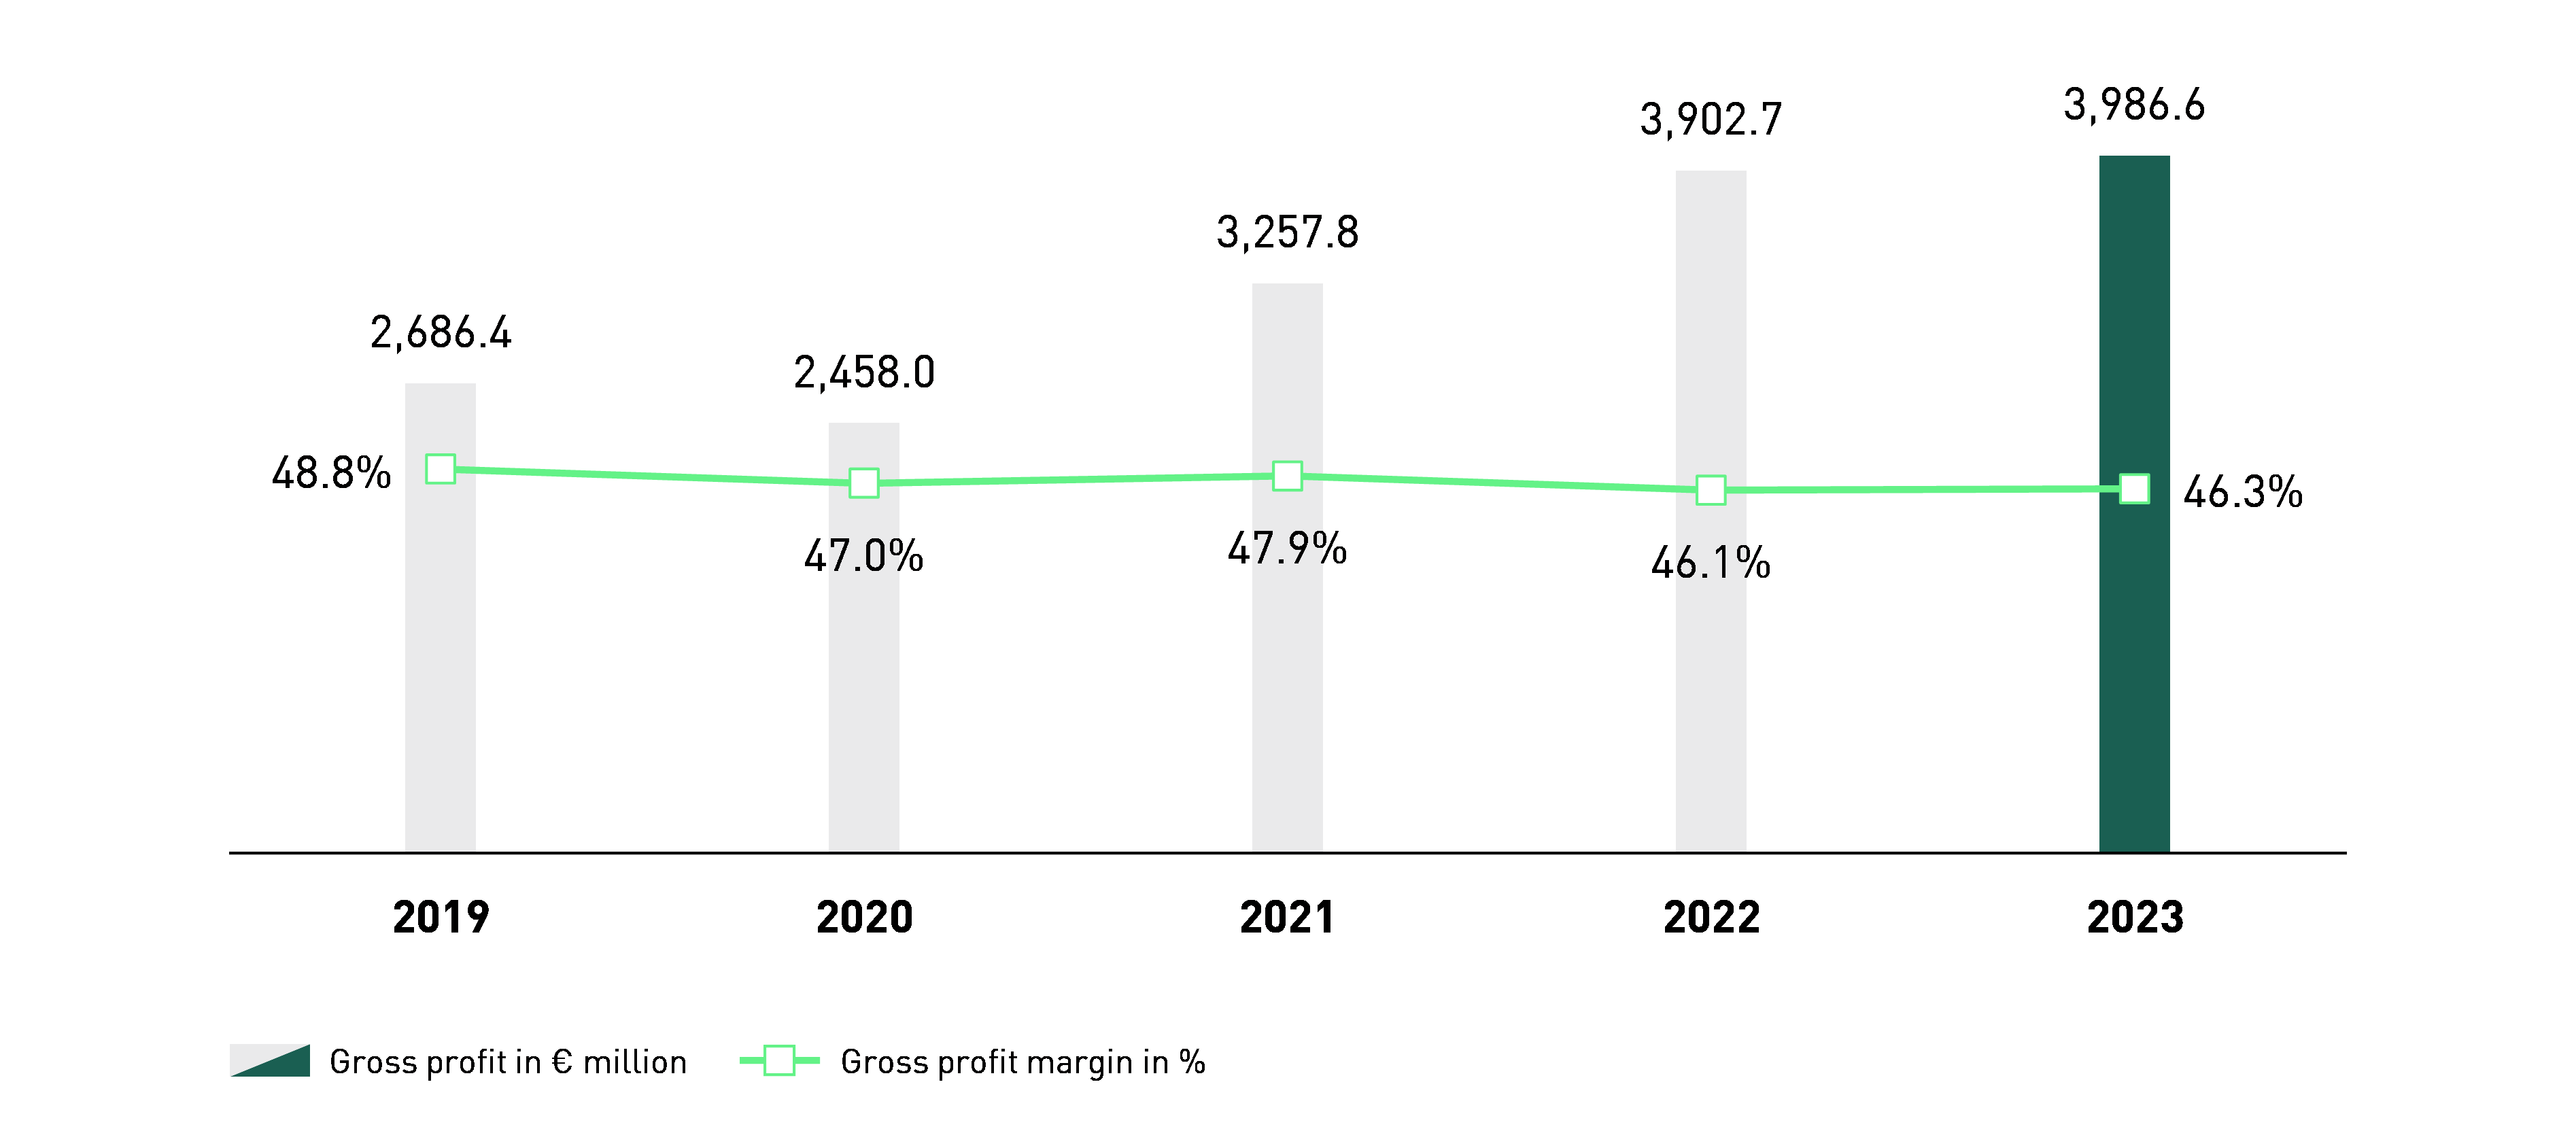
Gross profit margin
PUMA's gross profit in the financial year 2023 increased by 2.1% from € 3,902.7 million to € 3,986.6 million. The gross profit margin improved by 20 basis points from 46.1% to 46.3%. The increase was due to price adjustments, a more favourable regional and distribution channel mix, and positive currency effects. In contrast, a discount-intensive market environment with higher sales-promoting measures, fluctuating sourcing prices due to raw materials and fluctuating freight costs had a negative effect.
The gross profit margin in the footwear division improved from 44.9% in the previous year to 45.4% in 2023. The gross profit margin for apparel increased from 47.3% to 47.8%. In contrast, the gross profit margin for accessories fell from 47.4% to 46.6%.
↗ G.11 GROSS PROFIT/GROSS PROFIT MARGIN
Other operating income and expenses
The net expense of other operating income and expenses (OPEX) increased by 3.3% in financial year 2023 to € 3,403.5 million (from € 3,295.9 million in the previous year). The increase is due to sales-related distribution and other variable costs, the strong growth in our DTC sales channel and higher marketing investments. This development was partially offset by operational leverage in other cost areas and favourable exchange rate effects. The cost ratio increased from 38.9% in the previous year to 39.6% in 2023.

Within selling expenses, marketing/retail expenses increased by 4.1% to € 1,643.2 million, while the cost ratio was 19.1% of sales in 2023, compared with a cost ratio of 18.6% in the previous year. Other selling expenses, which mainly include sales-related costs and costs for warehousing and logistics, increased by 5.2% to € 1,155.8 million. The cost ratio of other selling expenses decreased to 13.4% of sales in 2023 compared to a cost ratio of 13.0% in the previous year.
Research and development/product management expenses increased by 12.0% to € 171.5 million compared to the previous year and the cost ratio rose slightly to 2.0%. Other operating income amounted to € 17.8 million in the past financial year and essentially includes income from the sale of fixed assets and income from the disposal of finance leases. General and administrative expenses fell by 3.2% to € 450.9 million in 2023. The cost ratio of general and administrative expenses improved to 5.2% of sales in 2023. Depreciation and amortisation is included in the relevant costs and total € 351.7 million (previous year: € 332.8 million). In addition, the respective costs include impairment expenses totalling € 5.7 million and corresponding reversals of impairment losses in the amount of € 11.9 million.
Result before interest, taxes, depreciation and amortisation (EBITDA)
The result before interest (= financial result), taxes, depreciation and amortisation (including impairment losses and reversals of impairment losses) (EBITDA) decreased by 3.2% to € 967.1 million in financial year 2023 (from € 999.3 million in the previous year). The EBITDA margin decreased from 11.8% in the previous year to 11.2% in 2023.
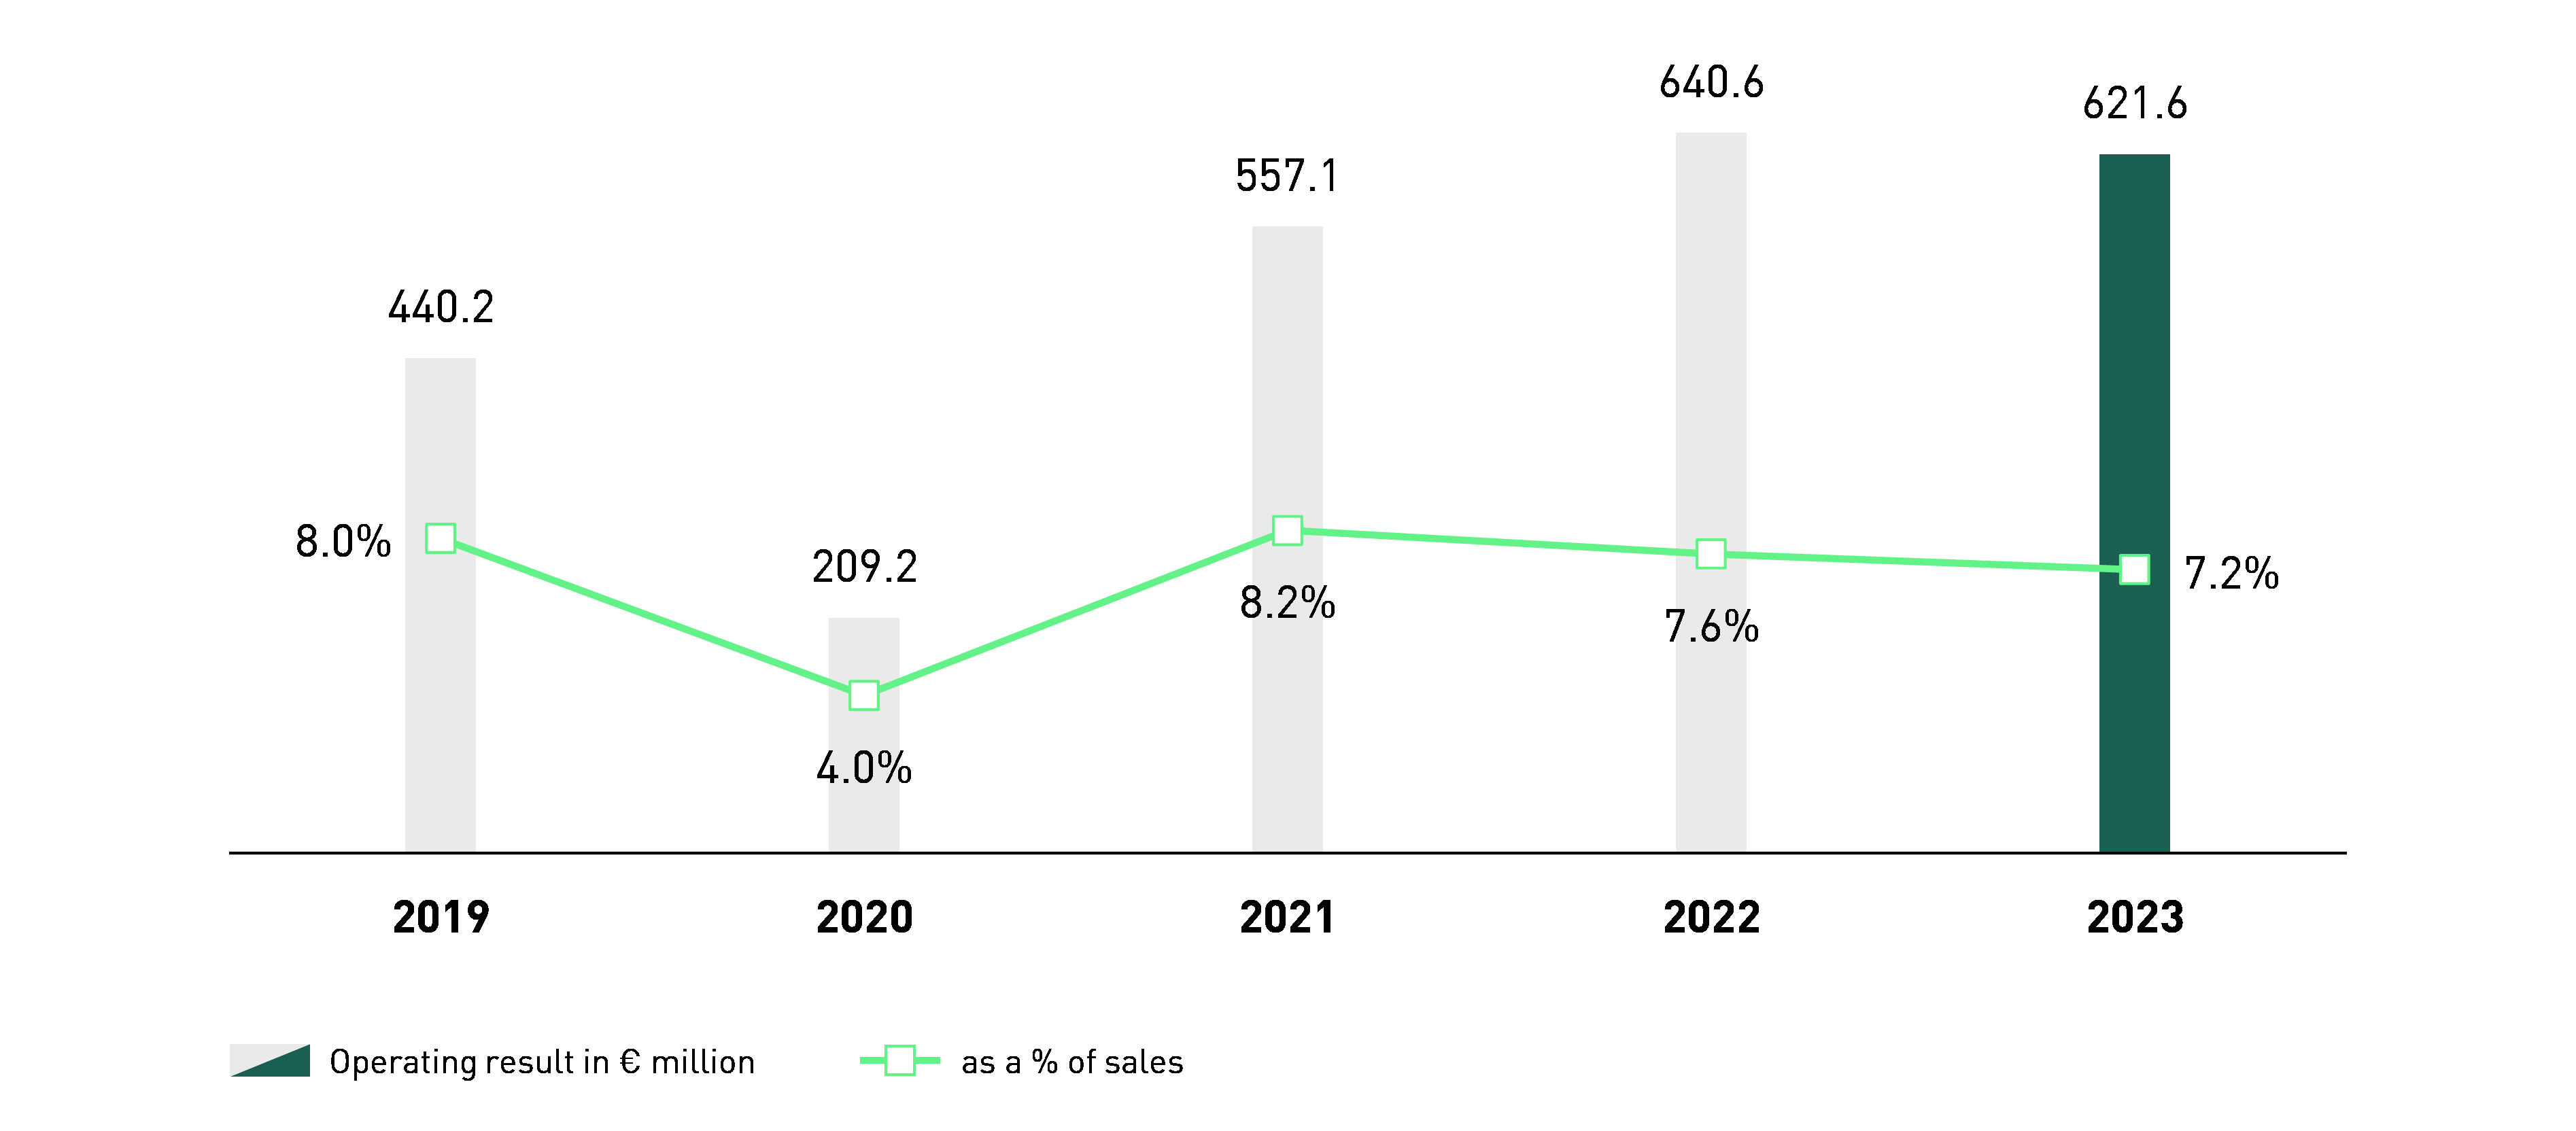
Operating result (EBIT)
In the 2023 financial year, operating result decreased by 3.0% to € 621.6 million (from € 640.6 million in the previous year). Despite higher sales and an improved gross profit margin, the slightly stronger increase in other operating income and expenses in comparison with sales led to this decline. The EBIT margin decreased from 7.6% in the previous year to 7.2% in 2023.
↗ G.13 OPERATING RESULT
Financial result
The financial result in 2023 decreased from a total of € -88.9 million in the previous year to € -143.3 million. This development is mainly due to the sharp increase in expenses from currency conversion differences totalling € -69.4 million in 2023, compared to just € - 2.2 million in the previous year, and also includes valuation losses in connection with the devaluation of the Argentine peso. The increase in interest expenses in 2023 to a total of € -100.8 million (previous year: € - 54.4 million) also contributed significantly to this development. In contrast, interest income increased to a total of € 37.8 million in 2023 (previous year: € 32.3 million) and expenses from hyperinflation effects fell to € - 23.7 million (previous year: € - 27.8 million). The remaining other financial income and expenses, which in particular include interest components in connection with forward exchange contracts ("swap points"), improved to € 12.8 million compared to € - 36.8 million in the previous year.
Earnings before taxes (EBT)
In the financial year 2023, PUMA generated earnings before taxes of € 478.3 million. This corresponds to a decrease of 13.3% compared to the previous year (€ 551.7 million). Tax expenses decreased to € 117.8 million, compared to € 127.4 million in the previous year. Accordingly, the tax rate rose from 23.1% to 24.6% in 2023.
Net earnings attributable to non-controlling interests
Net earnings attributable to non-controlling interests relate to companies in the North American market, in each of which the same shareholder holds a minority stake. The earnings attributable to these interests decreased by 21.4% to € 55.7 million in the financial year 2023 (previous year: € 70.9 million). The companies affected are PUMA United North America LLC, PUMA United Aviation North America LLC, PUMA United Canada ULC and Janed Canada LLC. The business purpose of these companies is mainly the sale of socks, bodywear, accessories and children's apparel in the North American market.
Consolidated net income
Consolidated net income decreased by 13.7% in financial year 2023 to € 304.9 million (from € 353.5 million). Despite higher sales and an improved gross profit margin, the slightly stronger increase in other operating income and expenses compared to sales and the declining financial result led to this development.
Earnings per share and diluted earnings per share decreased from € 2.36 in the previous year to € 2.03 in the financial year 2023, in line with the development of the consolidated net income.