Climate
1OFOR25 TARGETS
- Align PUMA’s CO2 emissions target with a 1.5-degree scenario (that is, what is required to limit global warming to 1.5 degrees)
- Move 100% of PUMA’s own entities to renewable electricity
- Expand the use of renewable energy at PUMA’s core suppliers to 25%
TARGET DESCRIPTION:
Old science-based CO2 emission target from 2019 aligned to well below 2 degrees:
- Reduce greenhouse gas emissions from PUMA’s own entities (Scope 1 and 2) by 35% by 2030 compared to the 2017 baseline (absolute reduction)
- Reduce emissions from PUMA’s supply chain (Scope 3: Purchased goods and services) by 60% relative to sales
New and 1.5 degree aligned science-based CO2 emission reduction target (approved 2023):
- Reduce absolute Scope 1 and 2 greenhouse gas emissions by 90% by 2030 from a 2017 base year
- Continue active annual sourcing of 100% renewable electricity through 2030
- Reduce absolute greenhouse gas emissions from purchased goods and services and upstream transportation and distribution by 33% by 2030 from a 2017 base year*
*Target boundary includes land-related emissions and removals from bioenergy feedstocks
Relates to United Nations Sustainable Development Goals 7 and 13
EXAMPLES OF THE 10FOR25 ACTION PLAN:
- Work with industry peers on climate action through the Fashion Industry Charter for Climate Action and the Fashion Pact
- Join industry-level energy efficiency programmes for suppliers in our top five sourcing regions
- Join industry-level programmes for renewable energy in our top five sourcing regions
- Replace all coal-fired boilers at PUMA’s core suppliers
- Reduce emissions from the transport of goods by transitioning to more carbon-efficient modes of transport
- Gradually transition to materials with a lower carbon footprint such as recycled polyester
- Switch all PUMA offices, stores and warehouses to renewable electricity tariffs or renewable energy attribute certificates
- Gradually move PUMA’s fleet vehicles to alternative engines (electric or hydrogen)
KPIs:
- Direct CO2 emissions from own entities (Scope 1*)
- Indirect CO2 emissions from own entities (Scope 2*)
- Indirect CO2 emissions from manufacturing, business travel and transport of goods (Scope 3*)
- Percentage of core suppliers covered by energy efficiency programmes
- Percentage of core suppliers covered by renewable energy programmes
- Percentage of core suppliers with coal-fired boilers (Tier 1 and Tier 2)
*The GHG Protocol Corporate Standard classifies a company's GHG emissions into three scopes:
•Scope 1: Direct GHG emissions from sources that are owned or controlled by the company (offices, stores, warehouses) e.g. office building heating, car fleet emissions.
•Scope 2: Indirect GHG emissions from the generation of purchased electricity, steam and heating/cooling consumed by the company
•Scope 3: All other indirect emissions not covered in Scope 2, such as extraction and production of purchased materials; transportation of purchased goods and use of sold products and services, business travel, employee commuting, etc.
During the UN Climate Conference in Paris in 2015, PUMA agreed to set a science-based CO2 emissions target. In 2018 PUMA co-founded the Fashion Industry Charter for Climate Action, an industry-wide coalition that aims to align the fashion industry’s emissions with the targets included in the Paris Agreement. One year later, PUMA agreed and published its first science-based emission target (SBT), which was aligned to a well below 2-degree emission scenario with the SBT Coalition and joined the Fashion Pact, which also includes a climate action commitment.
With an 85% reduction of own emissions (market-based, incl. the purchase of RECs) and a 65% reduction of supply chain emissions relative to sales, we achieved our first science-based greenhouse gas reduction target in 2023, seven years ahead of the target year 2030.
In 2022, we already prepared an updated and more ambitious science-based greenhouse gas reduction target and aligned the target with a 1.5-degree scenario. We also published a net zero target for 2050 and added a 100% renewable electricity target to our SBT proposal since we already committed to net zero GHG emissions and 100% renewable electricity as part of our Fashion Industry Charter for Climate Action engagement. Our updated science-based target was formally submitted to and approved by the SBTi in 2023.
With a 90% absolute reduction target for PUMA's own operations by 2030, the new target sets a much higher ambition level for Scope 1 and 2 emissions, after the first target of 35% reduction had already been achieved in 2020, mainly through the purchase of renewable energy and renewable energy attribute certificates. The SBTi has classified PUMA Scope 1 and 2 targets as in line with a 1.5-degree trajectory.
For Scope 3 emissions, the new 2030 target marks the transition from a target relative to sales (-60%) to an absolute reduction target of 33%. Given PUMA's strong growth rates, the new target could even be considered more ambitious.
Transition Plan toward our 2030 science-based GHG reduction target
During the year 2023, PUMA also developed and published its first climate transition plan. The plan lists the planned actions and investments toward hitting our 2030 climate targets.
In 2023, PUMA’s Chief Sourcing Officer joined Zero 100, a membership-based research and intelligence organisation, to accelerate progress on Digital Supply Chain Transformation and the path to zero carbon emissions. Forward-thinking Chief Operations and Supply Chain Officers of international companies partner up, sharing a common purpose – to harness new technology to re-invent the production, distribution and consumption of physical goods around the world.
PUMA CDP CLIMATE SCORE: A
The Carbon Disclosure Project (CDP) is an investor-led coalition that ranks global companies and cities for their climate strategies and disclosure. PUMA has been a long-term participant in the CDP, and we make our responses to the CDP questionnaire publicly available via the CDP website. In 2022, for the first time in PUMA’s history, we received an A score for our climate disclosure with CDP for the reporting year 2021. Until the end of January 2024, we retained our A score.
↗ G.12 PUMA CDP Climate Scores

↗ G.13 2022 CDP INDUSTRY AND GEOGRAPHICAL AVERAGE

PUMA’s rating is better than the average performance of the sector (textile and fabric goods) with an average rating of B. The overall global average rating stands at C.
Over the last two years, we have made significant improvements in value chain engagement, Scope 3 emissions, risk management processes and risk disclosure, leading to the highest possible rating of A. Our score increased as a result of a host of initiatives taken, including facilitating climate training programmes for our suppliers, the participation of our suppliers in industry-wide resource efficiency and renewable energy programmes, participation in Higg FEM, the recalculation of Scope 3 emissions, in line with the greenhouse gas protocol, life cycle assessments (LCA) for our products, the preparation of a climate roadmap for 2030 and a risk assessment.
For more information, please visit the PUMA sustainability website or the CDP website.
CLIMATE ROADMAP AND RISK ASSESSMENT
In 2021 we developed a climate roadmap and conducted a risk assessment using our risk assessment methodology. This roadmap laid the foundation for our climate transition plan, which was published in 2023. We see a regulatory landscape with unfavourable policies for renewables in some countries as a high risk. Furthermore, unstable business in our industry overall can restrain suppliers from investing in technologies and upgrading their facilities with low-carbon machinery.
Below are some key focus areas for the coming years. Some actions taken since 2021 and continued in 2023 are covered in this report.
- Raise awareness: We realised that suppliers need specific training to achieve the ambitious renewable energy targets and that challenges vary from region to region. We facilitated certain training programmes in partnership with industry experts as per the needs of suppliers, such as the possibility of purchasing renewable energy certificates in various regions. In 2023, we launched a new capacity development programme, called Supplier Leadership on Climate Transition (LOCT), to enable selected suppliers to set and achieve Science Based Targets. Our suppliers continued to attend the GIZ Climate Training programme at their own pace in 2023. The details of these training sessions are provided in the table in “Climate Training 2023”.
- Knowledge of impact: In 2023, we continued to conduct Life Cycle Assessments (LCA) for two top-selling products. We also conducted a comparative LCA of three types of polyester team sports jerseys to evaluate the environmental impacts of virgin polyester, recycled polyester made from PET bottles and recycled polyester made from recycled post-consumer waste and PET bottles. We also conducted a comparative LCA study of the environmental impacts of virgin cotton and blended cotton (75% virgin and 25% recycled). We intend to use the outcomes of these LCA studies to increase internal awareness and improve the products' carbon footprint by increasing the use of low-carbon materials, improving resource efficiency, optimizing energy use, promoting renewable energy in the value chain and enhancing the circularity of our products. LCA results are reported in the Productssection of this report.
- Internal action: We reviewed factories’ performance scorecards in 2023 based on their Higg FEM overall score and chemical score with our sourcing leaders. We also discussed with suppliers about their performance through one-to-one meetings and aligned on the next steps. We initiated a pilot to test a data platform, which will help us to measure progress more frequently. We will keep our focus on increasing the use of recycled materials in our products and explore opportunities to use more biosynthetic materials. In 2023, PUMA upgraded its near-term science-based emissions reduction target which includes our Scope 1 and Scope 2 emission targets in line with a 1.5-degree Celsius trajectory. We continue to enroll more factories in cleaner production programmes and renewable energy programmes. In 2023, the number of core factories with coal-fired boilers reduced from 21 in 2022 to 17 due to our business priorities that implied the revision of our core factory list. Two factories out of 17 have successfully phased out coal and 11 factories have partially replaced coal. The remaining four factories completed a feasibility study and will initiate replacement in 2024. We remain committed to phasing out coal from our core supply chain.
- Collaboration and partnership: We will keep our active engagement in the Fashion Charter to drive collaboration on climate actions and influence policymakers to enable access to affordable renewable energy. In 2023, we participated in a dialogue event organised by UN Fashion Charter with Bangladesh policymakers on renewable energy policy.
TASK FORCE ON CLIMATE-RELATED FINANCIAL DISCLOSURES (TCFD)
Climate change has been a focus area for PUMA since the publication of the first Environmental Profit and Loss Account in 2011. As a long-term and A-ranked respondent of the investor-led CDP questionnaire and a founding member of the UN Fashion Industry Charter for Climate Action, PUMA has shown its commitment to combatting climate change. Subsequently, we recognise the importance of disclosing climate-related risks and opportunities in line with the recommendations of the TCFD, which are now being transitioned into the IFRS standards.
The success of our business over the long term will depend on the social and environmental sustainability of our operations, the resilience of our supply chain and our ability to manage the potential impact of climate change on our business model and performance.
Through the implementation of the recommendations set by the TCFD, we summarize the actions PUMA has taken to review its key climate-related risks and opportunities, and the potential impacts on its business and strategy.
Governance
The PUMA Board of Management takes overall accountability for the management of all risks and opportunities, including climate change. PUMA’s CEO is responsible for the overall oversight of the group’s strategy, including the Sustainability Strategy. This includes climate-related targets as stated in PUMA’s 10FOR25 sustainability targets. Besides the oversight of the CEO, PUMA’s Chief Sourcing Officer (CSO) oversees all sustainability-related topics at PUMA, including climate change, at the management board level. Responsibilities of the CSO include approving new climate-related targets, strategies and initiatives. Sustainability falls under the scope of the CSO because the vast majority of the environmental impact of PUMA’s activity is generated during the manufacturing of our products, which are sourced from independent third-party vendors. Therefore, to reduce our climate impact, our Sustainability Strategy needs to be driven through our supply chain into our vendors’ factories and into the components we procure. Responsibility for these two activities lies with the CSO.
The Supervisory Board Sustainability Committee is handling sustainability at a Supervisory Board level. The Management Board receives updates on sustainability-related matters quarterly, including those related to climate change. The CSO has a monthly meeting with the sustainability leads for corporate and supply chain sustainability in which climate and all other sustainability-related topics are governed. The Executive Sustainability Committee meets twice a year to discuss and govern cross-functional sustainability-related topics, like the sustainability bonus targets. It is comprised of all functional heads of the company, such as People & Organisation, Sourcing, Finance, IT, Marketing, Risk Management, Investor Relations, Retail, Logistics and Legal Affairs. Sustainability at a product level is governed in a cross-functional business units call, where updates on PUMA’s more sustainable product strategy are shared and discussed monthly. To engage with PUMA’s worldwide subsidiaries on climate change and other sustainability-related topics, the corporate sustainability department organises a quarterly call in which the nominated sustainability leads for each PUMA subsidiary take part.
All PUMA leaders globally – from CEO to Team Head level – have clearly defined sustainability targets as part of their annual performance bonus. These targets are aligned with PUMA’s FOREVER. BETTER. Sustainability Strategy and focus on our 10FOR25 target areas, including climate change. Climate-related bonus targets include a reduction in air freight to 0.5% as well as a gradual shift of PUMA’s car fleet to zero or low-emission vehicles. Targets on recycled polyester also support our Scope 3 GHG reduction. The targets cover 10% of the overall bonus for members of the Management Board and 5% for other leaders globally., with climate-related targets accounting for 2,5% and 1.25% respectively.
Our sustainability governance structure is referenced in the Sustainability Organisation and Governance Structure section.
Strategy and risk management
PUMA has analysed risks and opportunities related to climate change for over 10 years and identified climate change as a material risk to PUMA during its last materiality analyses conducted in 2018 and 2023. Climate Change has the potential to impact PUMA’s business in the short (0-2 years), medium (2-5 years) and long term (5-10 years). The climate-related risks can be grouped into physical risks and transitional risks. Physical risks for PUMA include extreme weather events, such as flooding or heat waves, or water scarcity, which can influence raw material availability. Transitional risks include all risks related to the transition to a low-carbon economy, such as changing consumer preferences, policies and regulations, such as carbon taxes or rising energy prices.
The process for assessing, identifying and managing climate-related risks is the same for all principal risks and is described in the Risk Management section. All risks are monitored and reported regularly throughout the year by the risk owners, who are the managers of the functional areas and the managing directors of the subsidiaries. The risk owners are also responsible for the operational management of the identified risks. For example, climate risks concerning manufacturing in the supply chain are managed by PUMA’s Supply Chain Sustainability team.
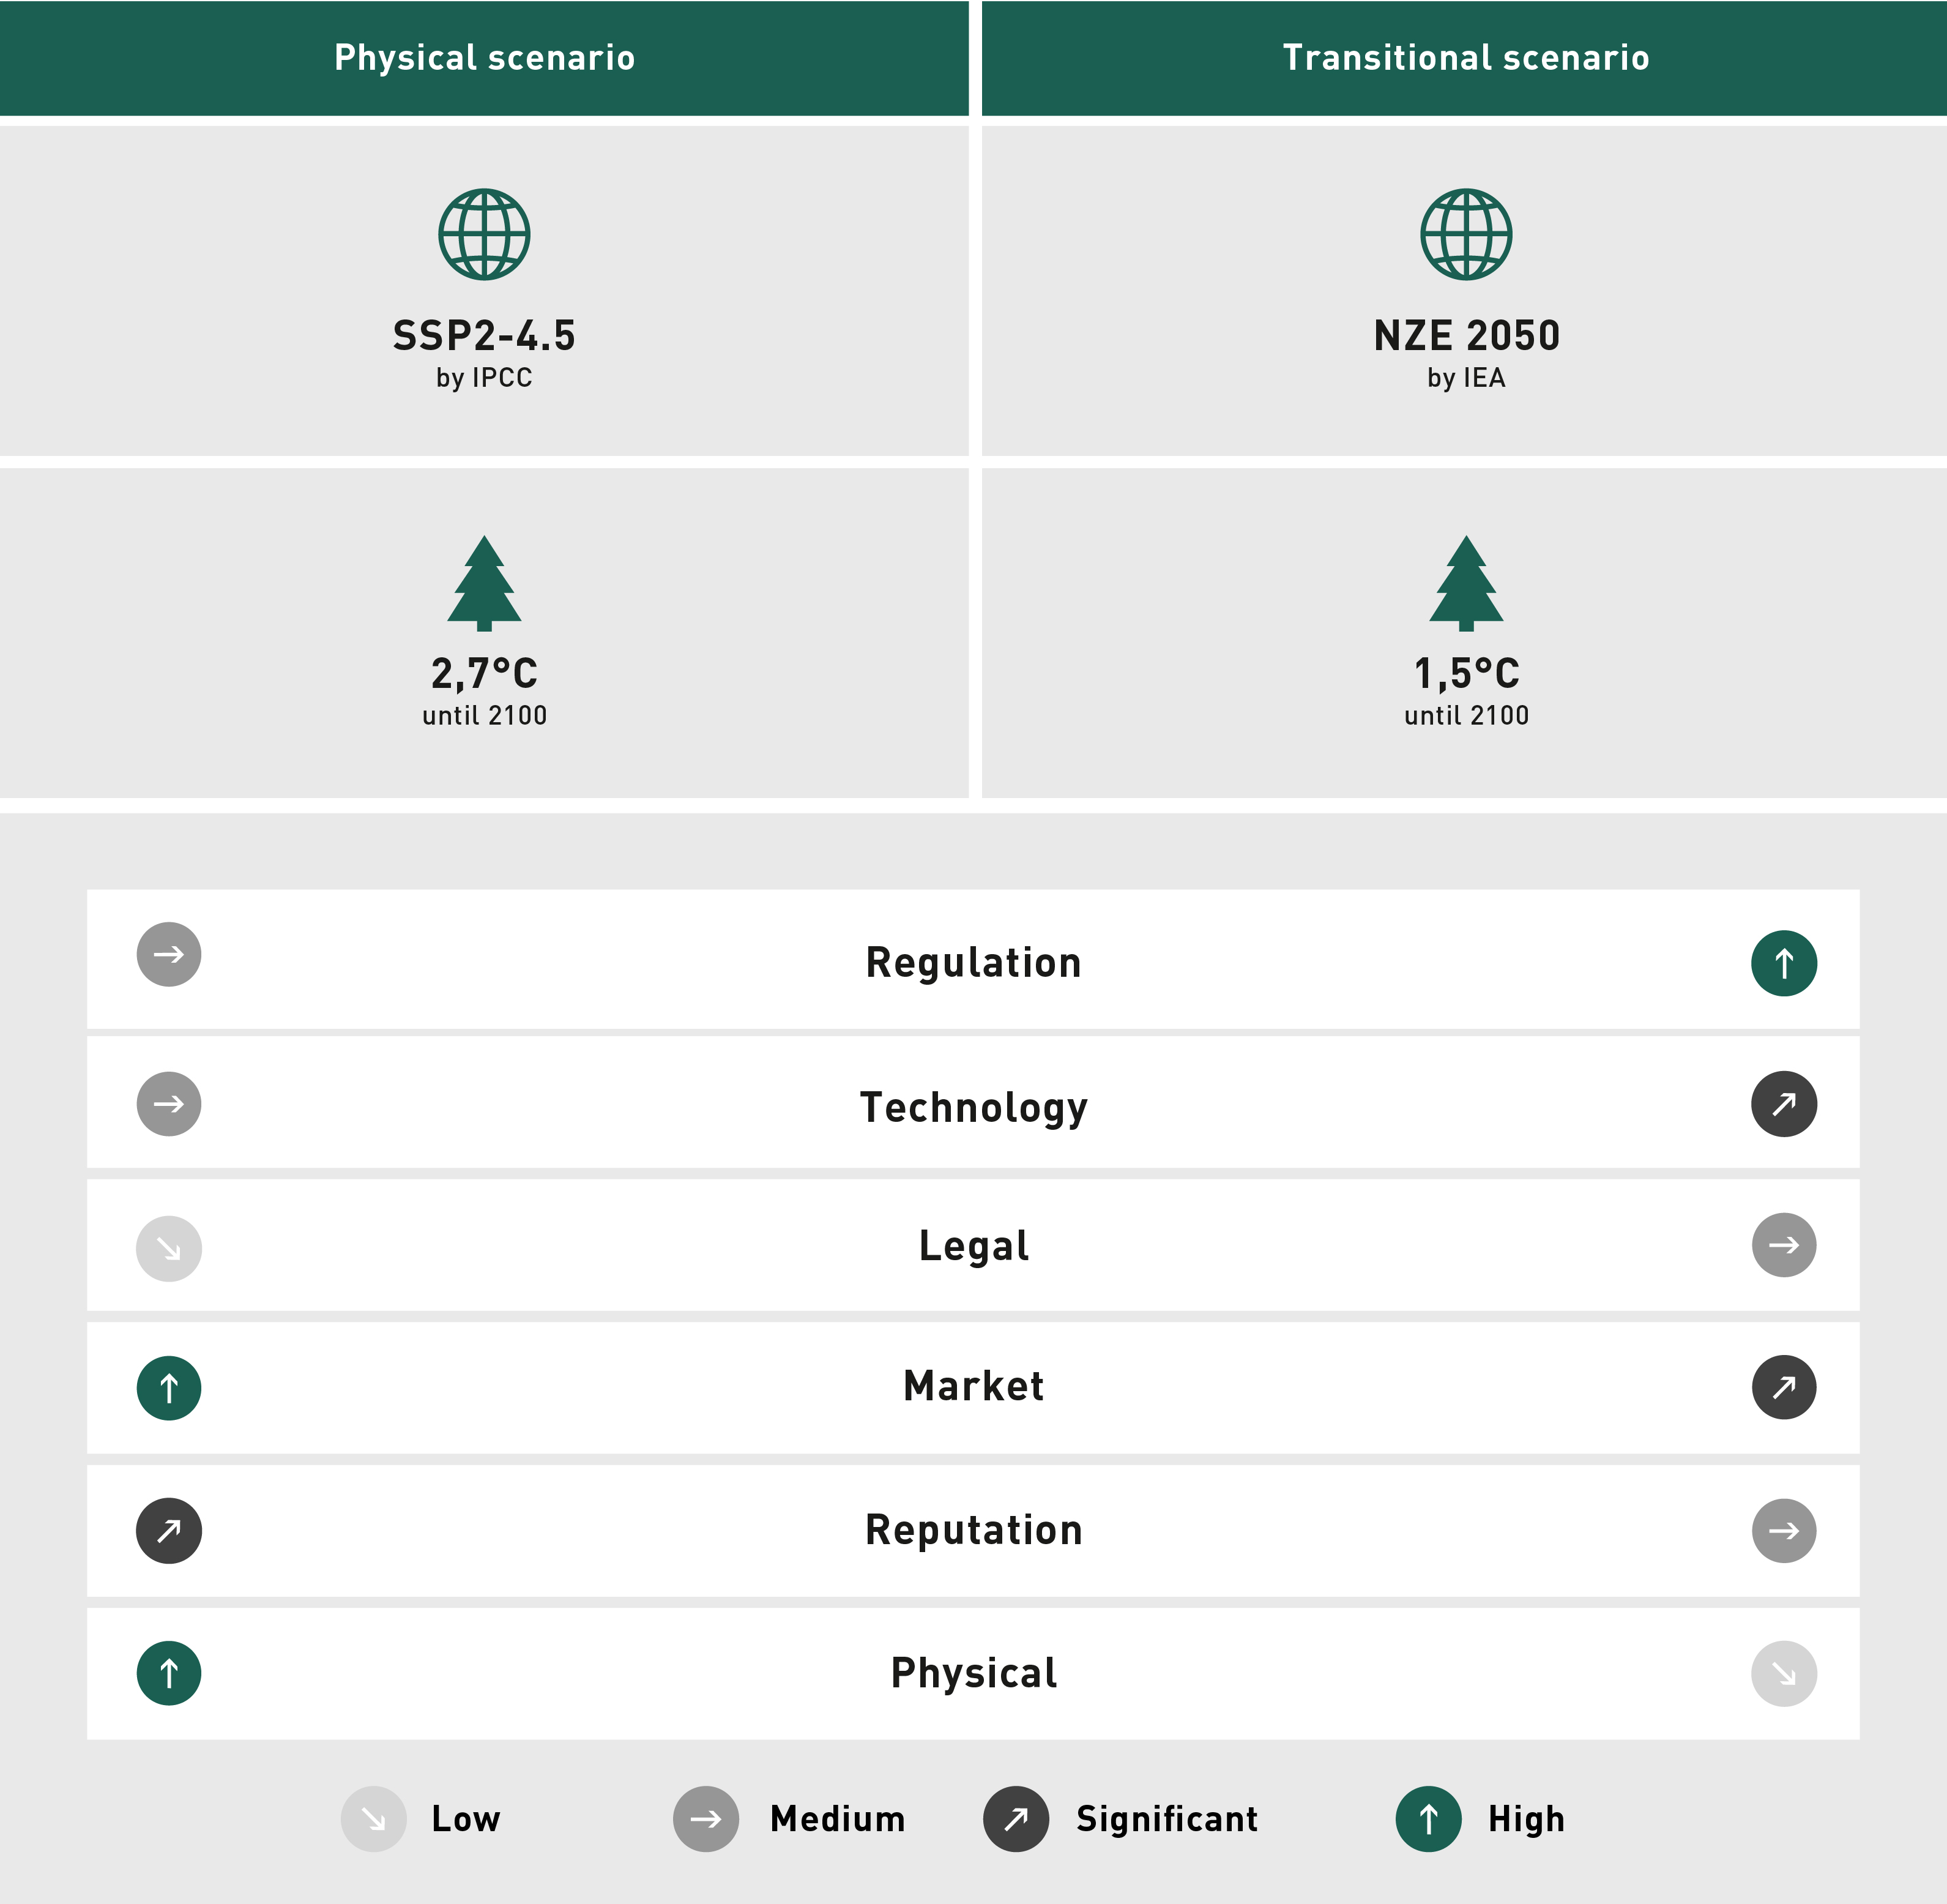
To identify the impact of potential climate-related risks, a scenario-based analysis of climate-related risks was commenced in 2022 (see G.16). The analysis is in line with TCFD recommendations by taking into consideration two different climate-related scenarios: first, to analyse transitional risks, the Net Zero Emissions by 2050 Scenario (NZE) developed by the IEA was considered. This scenario represents the development of a low-carbon economy in line with global warming of 2°C or lower. It was also used to develop our 1.5°C aligned science-based target, which was submitted at the beginning of 2023. Second, the impact of physical risks was assessed using the SSP2 – RCP4.5 scenario. This scenario relies on the Representative Concentration Pathways (RCPs) and Shared Socioeconomic Pathways (SSPs) published by the IPCC and reflects the development of greenhouse gas emissions under current government policies, resulting in warming of about 2.7°C by 2100 (per Climate Action Tracker). The different risk categories shown in G.16 are taken from our CDP 2023 response.
↗ G.14 Scenario-based risk analysis aligned with TCFD recommendations
Climate-related risks and opportunities have influenced PUMA’s strategy in multiple areas. The demand for more sustainable products has influenced our product portfolio and sourcing practices to shift towards recycled and/or certified materials. On the supply chain side, PUMA invests in supplier programmes focused on energy efficiency and renewable energy to reduce the carbon footprint of its manufacturing process. PUMA is investigating and investing further in more sustainable material options, such as biodegradable or recyclable materials. Additionally, PUMA operates its Circular Lab, under which it collaborates with innovation partners on different pilot projects, such as a garment-to-garment recycling process and a biodegradable shoe. Within its own operations, PUMA reduces its carbon footprint by sourcing 100% renewable electricity since 2020 and by gradually shifting its car fleet to low- and zero-emissions vehicles.
Climate-related issues also had an impact on PUMA’s financial planning. Direct costs have been influenced by ESG-linked supplier financing programmes that have been in place since 2016. The programme provides access for PUMA suppliers to external financing resources with favourable financing conditions. Additionally, as part of the EU Taxonomy Regulations, PUMA is required to report on capital expenditures that lead to greenhouse gas reductions. PUMA’s sales are currently not eligible under the EU Taxonomy Regulation due to the nature of PUMA’s business (sale of footwear and apparel). In 2023, PUMA identified investments in zero-emissions vehicles and infrastructure such as charging stations as well as solar PV installations to be aligned with Taxonomy criteria. The overall Taxonomy-aligned investment amounts to EUR 910,000. Further information on the EU Taxonomy can be found in the Reporting in Accordance with the EU Taxonomy Regulation section. Sustainability also influences PUMA’s access to capital as it becomes an increasingly important topic for attracting equity and investors. In 2023, PUMA received an AAA rating from MSCI for its sustainability efforts. PUMA is also listed in the FTSE4Good Index. Our Investor Relations and Sustainability teams are in an ongoing dialogue with investors on ESG topics. PUMA maintains a revolving credit facility and two promissory notes, which are linked to the achievements of five ESG targets as defined within our 10FOR25 ESG framework. The targets relate to the sourcing of renewable electricity (climate), sourcing of materials from certified sources (biodiversity), reduction of water consumption at core suppliers (water and air), elimination of plastic bags in stores (plastics and the oceans) and community engagement (human rights).
The results of our scenario analysis are used to ensure the necessary mitigating controls are in place, support PUMA’s risk management activities and inform future business strategies. We will update our scenario modeling as more climate data becomes available and regularly reframe the risks and opportunities to PUMA presented by climate change.
Metrics and targets
PUMA has been measuring and reporting environmental key indicators for its own operations and its T1 and T2 suppliers for many years, including energy consumption, carbon emissions, water consumption and waste management. These are part of the Sustainability section of its Annual Report, which is published annually and audited by a third party.
PUMA aligns its reporting on climate-related metrics with recognised standards, including the GHG Protocol. In addition, our 10FOR25 sustainability targets include absolute carbon reductions, renewable energy procurement and manufacturing of more sustainable products. Further information on our environmental KPIs can be found in the Environmental Key Performance Data section and throughout this report.
Sourcing 100% renewable electricity for all PUMA entities from 2020 is one of the milestones of PUMA’s climate change mitigation efforts. For its suppliers, PUMA has a target of sourcing 25% renewable energy by 2025 (2023: 22.1%). During 2023, our 1.5 degree aligned near-term SBT was approved by the Science Based Target Initiative: reducing absolute Scope 1 and 2 GHG emissions by 90% (market-based*, including the purchase of RECs) by 2030 and reducing absolute Scope 3 GHG emissions by 33% by 2030, both from a 2017 baseline year.
- Scope 1 and 2 targets focus on GHG emissions from our direct operations (including electricity and gas consumption at our stores, offices, internal manufacturing and distribution centres)
- Scope 3 targets relate to indirect GHG emissions in our extended supply chain and the transportation of finished goods
By the end of 2023, PUMA had already reduced its combined Scope 1 and 2 emissions by 85% and its Scope 3 emissions from purchased goods and services and transportation by 28%. Our efforts in sourcing more sustainable materials led to 99.2% cotton, 99,7% leather and 85% polyester coming from recycled or certified sources and eight out of ten products being more sustainable in line with our internal definition. We also reduced our GHG emissions from materials by 50%.
As part of its commitment to the UN convened Fashion Industry Charter for Climate Action, and according to PUMA’s Environmental Handbook, PUMA declared its ambitions to meet a net zero 2050 goal. PUMA recognises that meeting its climate-related targets is dependent on collective action and focus. Improving the market conditions for clean energy supply, such as the rate of installation of renewable electricity in many countries, reducing costs and the availability of power purchase agreements (PPAs) will help shift the rate of decarbonisation at scale. PUMA believes it has a role to play in helping to shape the policy and regulations required and is working collaboratively with partners, suppliers and other organisations to achieve its ambition, including the United Nations Global Compact, the UN Fashion Industry Charter for Climate Action, the Fashion Pact and Stiftung Klimawirtschaft. PUMA met with representatives of the delegations of Bangladesh, Indonesia and Vietnam during the UN COP 28 climate conference to promote the further expansion of renewable energy in those countries.
*A market-based method reflects emissions from electricity that companies have purposefully chosen. It derives emission factors from contractual instruments, which include any type of contract between two parties for the sale and purchase of energy bundled with attributes about the energy generation, or for unbundled attribute claims.
Scope 1 Emissions
Our own direct CO2 emissions (Scope 1) are mainly caused by emissions from our PUMA car fleet and airplane, as well as emissions from the heating of buildings. We are tackling the emissions from our car fleet by gradually transitioning to zero-emission vehicles in those countries where the charging infrastructure is mature enough to support the transition. Starting in 2023, only electric vehicles are allowed as new additions to our car fleet in the region of Germany, Austria and Switzerland, which includes our Headquarters and 242 cars. At the end of 2023, 319 out of 905 cars (35%) globally were already low or zero -emission battery electric or hydrogen fuel cell cars, in line with our bonus target of hitting 30%.
We also significantly expanded the charging infrastructure at our headquarters and selected other offices and now have over 75 charging stations in operation, including twelve public charging stations at our headquarters stores that can be used by employees, business partners and customers free of charge.
For the heating of buildings, we use natural gas in 8% of buildings globally and plan to transition these buildings to biogas or other renewable heat sources over time. Many PUMA buildings globally already use (renewable) electricity for heating.
Overall we were able to reduce our Scope 1 GHG emissions by 17% between 2017 and 2023, and plan to reduce these emissions further by 2025.
Scope 2 Emissions
PUMA’s indirect GHG emissions (Scope 2) are caused by the electricity used for running our offices, stores and warehouses, including the charging of electric cars, as well as thermal energy used from district heating.
All of our offices, stores and warehouses have used renewable electricity via green electricity tariffs or renewable energy attribute certificates since 2020. This has led to a significant reduction of our Scope 2 emissions (market-based). In addition, the closure of our stores in Russia, which were mostly heated by district heating, contributed further to the reduction of Scope 2 emissions. At our headquarters, which is by far the largest consumer of district heat among all PUMA entities, the district heat is created in co-generation with electricity and by using over 50% biogas. In total, we were able to reduce our Scope 2 emissions by 99% (market-based, incl. the purchase of RECs) since 2017.
Further actions to reduce PUMA’s own greenhouse gas emissions include the use of energy-efficient heat pumps at our headquarters, frequent energy efficiency audits at our stores, a free public transport ticket for employees, job-bike-leasing and a meat-free Monday at canteens.
2023 | 2022 | 2021 | 2020 | 2019 | 2017 | % Change 2023/2022 | % Change 2023/2017 | |
Scope 1 – Direct CO2e-Emissions Fossil fuels* | 6,403 | 6,206 | 4,456 | 4,179 | 6,326 | 7,678 | 3% | -17% |
Vehicle Fleet | 2,639 | 2,264 | 2,008 | 1,985 | 3,618 | 4,134 | 17% | -36% |
Heating | 1,336 | 1,536 | 2,039 | 2,194 | 2,708 | 3,545 | -13% | -62% |
Air Plane* | 2,428 | 2,405 | 410 | 689 | 2,359 | - | 1% | |
Scope 2 – Indirect CO2e Emissions (location-based) | 41,679 | 35,528 | 32,545 | 29,839 | 40,986 | 40,029 | 17% | 4% |
Scope 2 – Indirect CO2e Emissions (market-based) | 530 | 643 | 1,458 | 1,078 | 11,533 | 40,029 | -18% | -99% |
Electricity (location-based) | 41,149 | 34,885 | 31,087 | 28,761 | 39,282 | 38,914 | 18% | 6% |
Electricity (market-based) | - | - | - | - | 9,828 | 38,914 | -100% | |
District heating | 530 | 643 | 1,458 | 1,078 | 1,705 | 1,115 | -18% | -52% |
Total Scope 1-2 (location-based) | 48,082 | 41,734 | 37,001 | 34,018 | 47,312 | 47,707 | 15% | 1% |
Total Scope 1-2 (market-based) | 6,933 | 6,849 | 5,914 | 5,257 | 17,859 | 47,707 | 1% | -85% |
Scope 1-2 Relative to Sales (t CO2e per € million sales) (location-based) | 5.6 | 4.9 | 5.4 | 6.5 | 8.6 | 11.5 | 13% | -51% |
Scope 1-2 Relative to Sales (t CO2e per € million sales) (market-based) | 0.8 | 0.8 | 0.9 | 1.0 | 3.2 | 11.5 | 0% | -93% |
|
|
|
|
|
|
|
|
|
* In 2022, Scope 3 Upstream Leased Assets was restructured. Previously, this category included the emissions from PUMA Air Plane and well-to-tank emissions from PUMA Vehicle Fleet. Now, in line with GHG Protocol, emissions from PUMA Air Plane are included in Scope 1, well-to-tank emissions from PUMA Vehicle Fleet are included in Scope 3 Fuel- and energy-related activities and Scope 3 Upstream Leased assets includes the emissions from warehouses in PUMA’s value chain that are operated by a third party.
** A location-based method reflects the average emissions intensity of grids on which energy consumption occurs.
*** A market-based method reflects emissions from electricity that companies have purposefully chosen. It derives emission factors from contractual instruments, which include any type of contract between two parties for the sale and purchase of energy bundled with attributes about the energy generation, or for unbundled attribute claims. PUMA has purchased such Energy Attribute Certificates in 2023.
1. PUMA’s greenhouse gas reporting is in line with the GHG Protocol International Accounting Standard. Fugitive emissions (emissions from unintentional releases or leaks) are not included in Scope 1 emissions.
2. Methodological changes over the last three years have influenced results. In 2020 updated emission factors were applied and the consolidated structure changed due to full alignment with the GHG Protocol.
3. The consolidation scope follows the operational control approach, including PUMA-owned or operated offices, warehouses, stores and own industrial sites (Argentina).
4. PUMA applied emission factors from internationally recognised sources, such as the International Energy Agency (IEA) (2019) and DEFRA conversion factors (2020).
↗ G.15 AGREED EMISSION TARGETS (SCOPE 1 AND 2*) (t CO2e) 2023
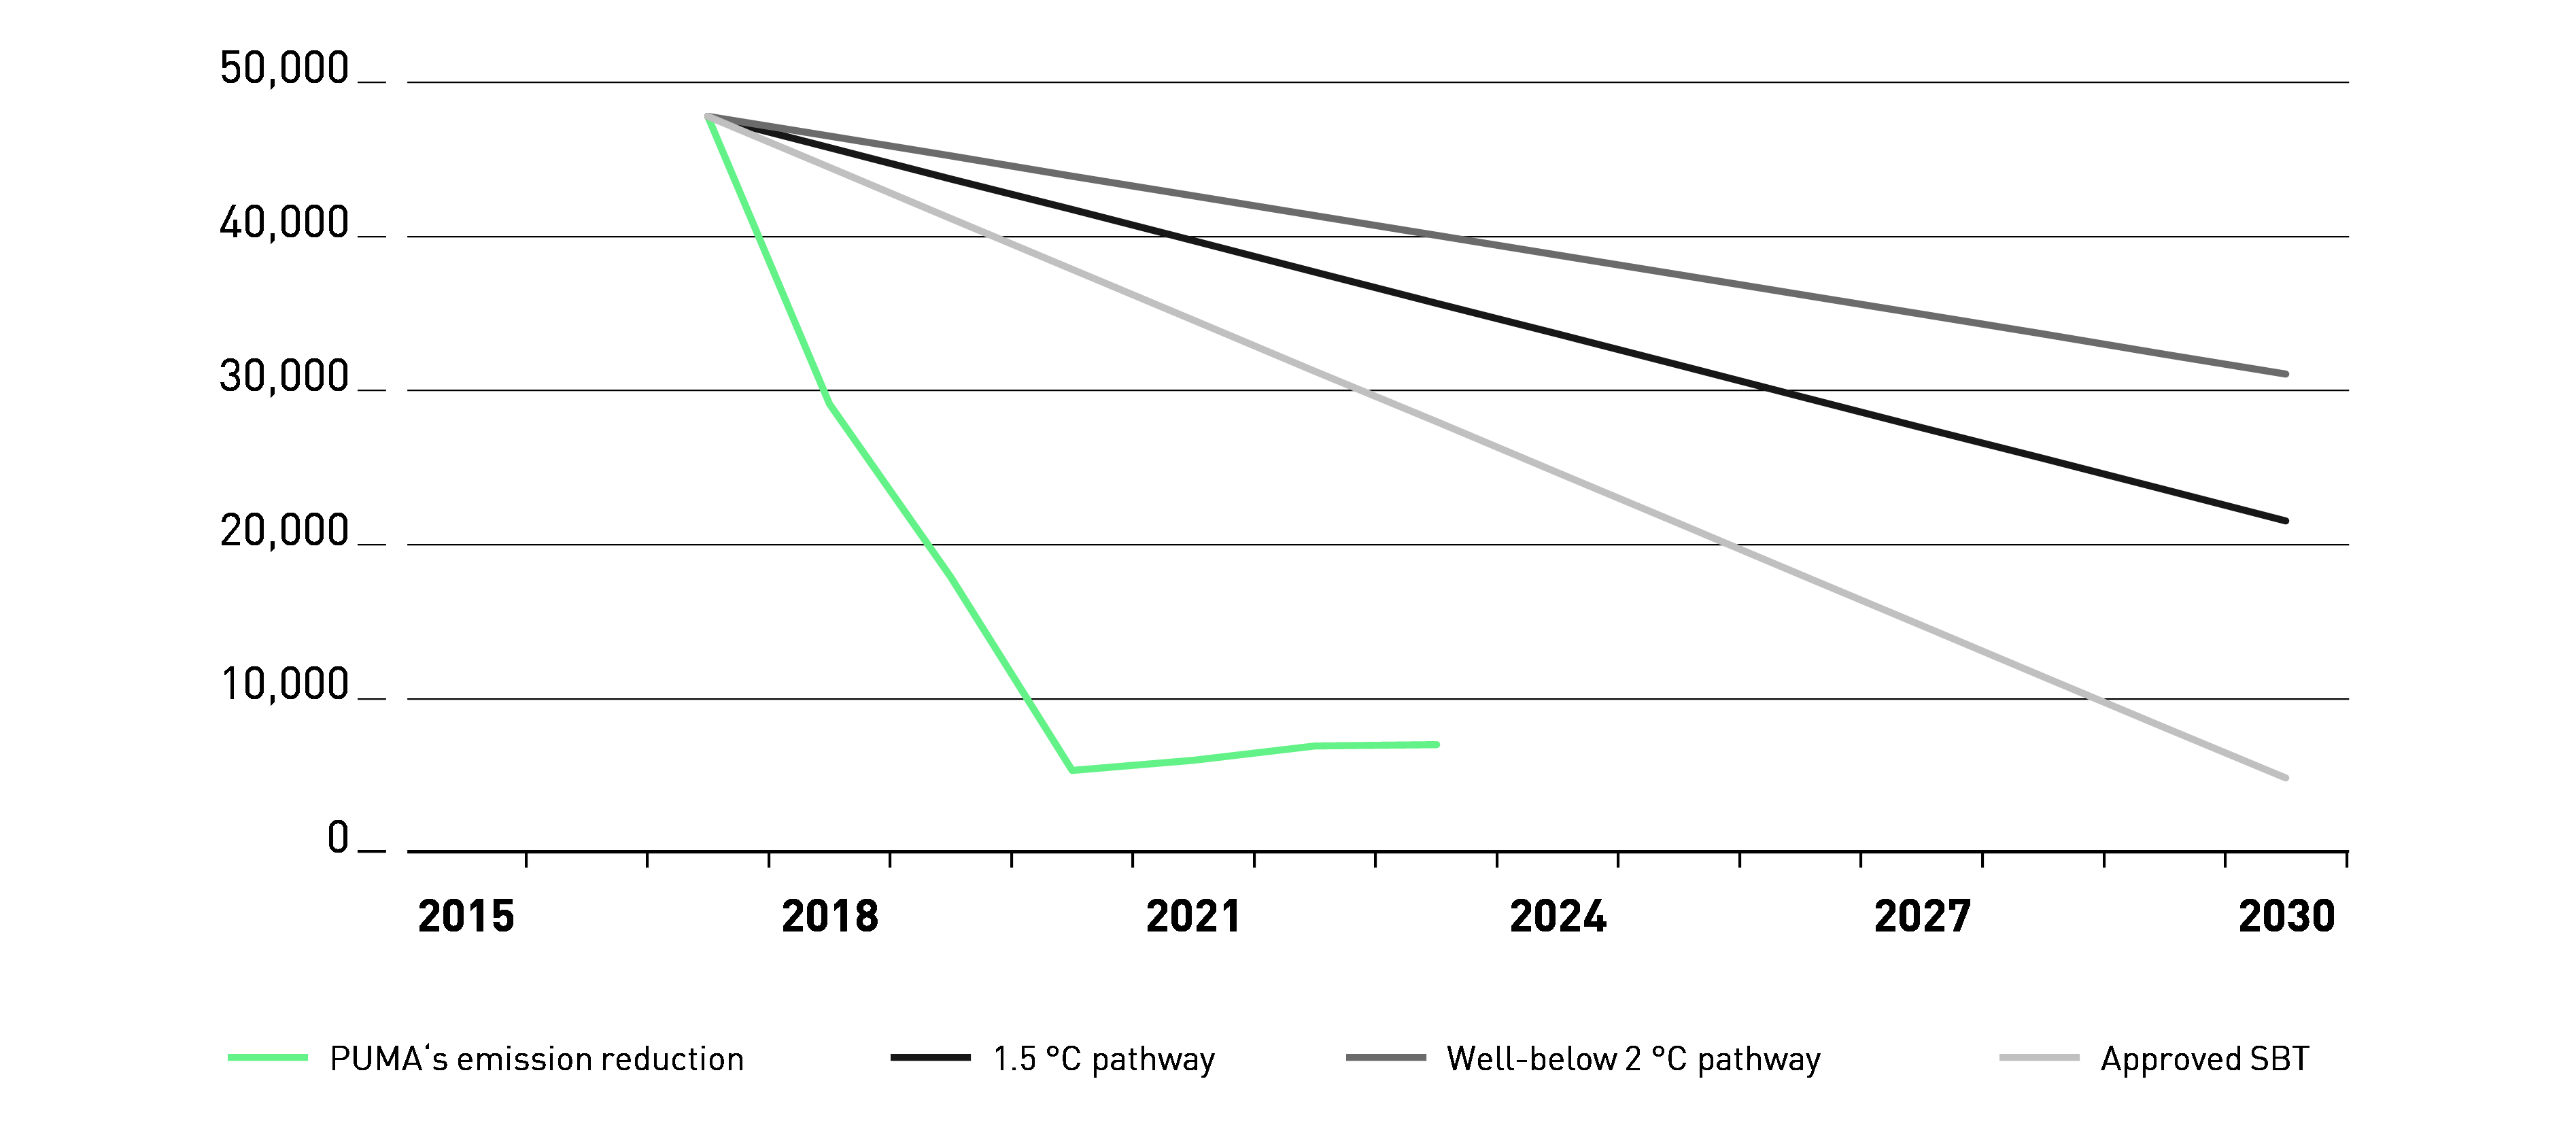
*Including renewable energy attribute certificates
2023 | 2022 | 2021 | 2020 | 2019 | 2017 | % Change 2023/2022 | % Change 2023/2017 | |
Total energy from electricity | 87,267 | 75,269 | 67,866 | 61,365 | 61,499 | 64,119 | 16% | 36% |
Non-renewable electricity consumption | 0 | 0 | 0 | 0 | 12,683 | 52,508 | - | -100% |
Electricity consumption from renewable sources (green tariffs and on-site photovoltaic) | 16,032 | 15,697 | 13,749 | 10,839 | 11,547 | 11,611 | 2% | 38% |
Percentage of renewable electricity consumption (excluding EACs) | 18% | 21% | 20% | 18% | 16% | 18% | ||
Electricity consumption guaranteed with EACs | 71,235 | 59,572 | 54,117 | 50,526 | 37,269 | 0 | 20% | - |
Percentage of renewable electricity consumption (including EACs) | 100% | 100% | 100% | 100% | 79% | 18% | ||
Total energy from non-renewable fuels (oil, natural gas, etc.) | 6,555 | 7,541 | 10,006 | 10,739 | 10,975 | 14,430 | -13% | -55% |
Total energy from district heating | 4,828 | 5,483 | 10,795 | 6,247 | 7,915 | 5,155 | -12% | -6% |
Total energy consumption (PUMA own entities) | 98,651 | 88,462 | 88,666 | 78,350 | 80,389 | 83,704 | 12% | 18% |
|
|
|
|
|
|
|
|
|
1 Figures include PUMA owned or operated offices, warehouses and stores. Includes our own production sites in Argentina. All other production is outsourced to independent supplier factories, some warehouse operations are outsourced to independent logistics providers. Franchised stores are excluded.
2 Data includes extrapolations or estimates where no real data could be provided.
3 Methodological changes over the last three years have influenced results.
Scope 3 Emissions
2023 | 2022 | 2021 | 2020 | 2019 | 2017 | % Change 2023/2022 | % Change 2023/2017 | |
Scope 3 – Indirect CO2e Emissions from corporate value chain | 1,089,971 | 1,430,690 | 1,355,633 | 1,486,324 | 1,762,087 | 1,502,162 | -24 % | -27 % |
Purchased goods and services* | 991,864 | 1,278,758 | 1,242,468 | 1,389,335 | 1,631,904 | 1,409,265 | -22 % | -30 % |
Fuel- and energy-related activities** | 4,736 | 4,220 | 3,700 | 3,463 | 3,712 | 7,433 | 12 % | -36 % |
Upstream transportation and distribution | 70,412 | 127,474 | 106,983 | 91,775 | 107,744 | 71,070 | -45 % | -1 % |
Inbound | 47,812 | 99,724 | 85,622 | 67,842 | 98,386 | 64,076 | -52 % | -25 % |
Outbound*** | 22,600 | 27,750 | 21,361 | 23,933 | 9,358 | 6,994 | -19 % | 223 % |
Business travel | 11,499 | 9,439 | 2,482 | 1,751 | 18,727 | 14,394 | 22 % | -20 % |
Upstream leased assets** | 11,460 | 10,799 | 6 % | - | ||||
Total Scope 1-3 (market-based) | 1,096,904 | 1,437,609 | 1,362,482 | 1,492,238 | 1,767,344 | 1,549,869 | -24 % | -29 % |
Annual Sales PUMA (in € million) | 8,602 | 8,465 | 6,805 | 5,234 | 5,502 | 4,136 | 2 % | 108 % |
Total Scope 1-3 Relative to Sales (t CO2e per € million sales) (market-based) | 127.5 | 169.8 | 200.2 | 285.1 | 321.2 | 374.7 | -25 % | -66 % |
Total Scope 3 Relative to Sales (t CO2e per € million sales) | 126.7 | 169.0 | 199.2 | 284.0 | 320.3 | 363.2 | -25 % | -65 % |
|
|
|
|
|
|
|
|
|
* The values for November and December 2023 were estimated by employing the Exponential Smoothing (ETS) algorithm in Microsoft Excel, utilizing data from January to October of 2023. This approach was chosen after comparing it to alternative methods, considering its performance against actual historical data, specifically in terms of deviation from the actual values in percentage terms. The ETS method displayed higher accuracy and higher precision compared to other methods, such as averaging the last 10/12 months or multiplying the estimated production by the average KPI (per production unit) from the 12 months of data spanning from November 2021 to October 2022.
** In 2022, Scope 3 Upstream Leased Assets was restructured. Previously, this category included the emissions from PUMA Air Plane and well-to-tank emissions from PUMA Vehicle Fleet. Now, in line with GHG Protocol, emissions from PUMA Air Plane are included in Scope 1, well-to-tank emissions from PUMA Vehicle Fleet are included in Scope 3 Fuel- and energy-related activities and Scope 3 Upstream Leased assets includes the emissions from warehouses in PUMA’s value chain that are operated by a third party.
*** In 2020, upstream outbound values were adjusted to fully cover the e-commerce business and exclude B2B express volumes.
1. PUMA’s greenhouse gas reporting is in line with the GHG Protocol International Accounting Standard. Fugitive emissions (emissions from unintentional releases or leaks) are not included in Scope 1 emissions.
2. Methodological changes over the last three years have influenced results. In 2020 updated emission factors were applied and the consolidated structure changed due to full alignment with the GHG Protocol.
3. The consolidation scope follows the operational control approach, including PUMA-owned or operated offices, warehouses, stores and own industrial sites (Argentina).
4. Outsourced Tier 1 production is accounted for in the Scope 3 emissions under purchased goods and services, covering CO2 emissions from all three product divisions (Accessories, Apparel and Footwear).
5.PUMA applied emission factors from internationally recognised sources, such as the International Energy Agency (IEA) (2019) and DEFRA conversion factors (2020).
6.For sea freight transportation, PUMA follows the recommendation and new methodology of the Clean Cargo Working Group that has transitioned from the use of tank-to-wheel (TTW) CO2 to well-to-wheel (WTW) CO2-equivalent emission factors for all fuels.
Greenhouse Gas Emissions from Purchased Goods and Services
PUMA is determined to reduce its carbon emissions, water usage, waste and air pollution at its offices and in its supply chain. For materials, PUMA strives to use more sustainable materials, such as cotton, polyester, leather and cardboard.
The purpose of PUMA’s environmental efforts is to ensure that its suppliers are in full environmental compliance and any negative impact on the environment is reduced. Ultimately, our goal is to achieve a positive environmental impact. We ask all of our core suppliers to complete the Facilities Environmental Module developed by the SAC.
For climate, PUMA’s 10FOR25 action plan includes steps such as:
- Work with industry peers on climate action through the Fashion Industry Charter for Climate Action and the Fashion Pact.
- Joining industry-level energy efficiency programmes for suppliers in our top five sourcing regions.
- Joining industry-level programmes for renewable energy in our top five sourcing regions.
- Replacing all coal-fired boilers at PUMA’s core suppliers.
- Gradually transitioning to materials with a lower carbon footprint, such as recycled polyester.
To reduce the emissions from the production of our PUMA products, we worked with our suppliers on programmes ranging from energy efficiency to installing on-site solar photovoltaic power plants to generate renewable energy.
The reduction of our Scope 3 emissions at the factory level is complemented by using more sustainable (less carbon-intensive) raw materials. In 2023, we used 85% more sustainable polyester, of which 61.8% was recycled polyester; 99.2% more sustainable cotton, mainly from the Better Cotton Initiative (BCI) and 99.7% leather from Leather Working Group medal-rated tanneries. In addition, 99.4% of our paper and cardboard packaging was recycled or FSC-certified paper. By 2025 we aim to use 75% recycled polyester and 100% recycled and/or certified paper and cardboard.
Supplier Training and Programme
In 2021, PUMA joined hands with other brands and key suppliers under the UN-led Fashion Industry Charter for Climate Action to develop a standard training programme on climate action for apparel and footwear suppliers in Asia, in partnership with GIZ. This online training programme provides foundational knowledge for suppliers on global decarbonisation efforts, GHG emissions accounting, climate target-setting methodology and solutions to reduce emissions and achieve these targets. The training is available in English and other local languages such as Khmer, Mandarin, Bengali and Vietnamese. We encouraged our suppliers to participate in this training, available free of charge.
The training provides foundational knowledge to suppliers on:
- Understanding global decarbonisation efforts
- How to account for GHG emissions
- How to implement available energy solutions to reduce emissions
In 2023, we continued to encourage factories to join the GIZ’s Climate Action Training. 57 participants from 42 factories completed the course and attempted the final exam. 100% of the participants successfully passed the exam and obtained the certificate from GIZ, with an average score of 75%. Since 2021, 933 participants from 284 factories have completed this course.
In 2023, we provided training to our suppliers on Science Based Target setting, renewable energy procurement through RECs, carbon trading and energy efficiency. This climate-related training helped to accelerate the implementation of rooftop solar projects, increase the purchase of renewable energy attribute certificates and initiate coal phase-out measures. The progress made in these areas are described in this report.
In 2023, we approached 21 selected supplier groups representing 40-50% of our business volume to suggest that they set Science-Based Targets at a company level (covering all of their factories, including the ones not producing for PUMA). In March 2023, 19 out of these 21 suppliers agreed to set up SBT; one supplier declined, and one supplier already had an approved target. In October 2023, we engaged with Guidehouse to launch the Supplier Leadership On Climate Transition (LOCT) capacity development programme. The programme provides a web-based platform to learn and implement a step-by-step approach for setting Science Based Targets and guidance on how to achieve those targets. Nine suppliers registered to join this programme in 2023. However, only eight suppliers joined, since one supplier selected a training available only after a supplier has set SBT. This supplier will join the programme in 2024. We expect more suppliers to join in early 2024. We do not expect all 20 suppliers to join this programme, since some suppliers have the required expertise in-house or are already engaged with a consultant to support them.
The renewable energy procurement training conducted by Monsson Carbon for Vietnam, Cambodia, Indonesia and the Philippines focused on how to procure energy attribute certificates such as iRECs, while the training conducted by Envision in China and Taiwan focused on iREC procurement and other green energy procurement schemes available in the region like green electricity consumption certificate (GECC). The percentage of training participation for factories in renewable energy procurement is 53%; as it was a refresher training in 2023, the supplier factories which have already purchased iRECs, or other forms of green energy certificates did not join.
In 2023, a training on carbon trading provided by IMPAQ (a third party organisation) was only relevant for textile/fabric core Tier 2 factories located in mainland China. However, all core Tier 1 and Tier 2 factories located in China and Taiwan regions were invited to attend for awareness about regulatory requirements in the area. As per these requirements, heavy industries in Guangdong province with greenhouse gas emissions of more than 10,000 tons per year or energy consumption of at least 5,000 tons of standard coal per year are required to be included in a carbon trading scheme. Although the textile sector is one of the potential sectors to be included, this regulation is still not enforced for the textile sector. Because of this, 53% of core Tier 2 textile factories invited attended this training, whereas only 44% of non-textile core Tier 2 factories joined this session. However, 76% core Tier 1 factories joined this training due to better engagement with them. In total, 59% of factories invited attended this training. If the scope of these regulatory requirements expands to other product divisions, we will continue to provide this training in the future.
For the German Training Week on Energy Efficiency programme, organised by GIZ in Vietnam, PUMA was allocated only eight slots, and eight core factories joined the programme. Hence, the percentage of core factories which participated relative to the total number of core factories in Vietnam (47) is only 17%.
Scope | Country | Trainer | Number of suppliers | Number of factories | Number of participants | % factories trained* | ||||||
Science Based Target networking sessions | Suppliers selected for SBT | Global | Guidehouse/ CDP/ | 21 | 48 | 215 | 100% | |||||
LOCT program | Suppliers selected for SBT | Global | Guidehouse | 8 | 24 | 23 | 50% | |||||
Renewable Energy Procurement - | All core factories | Vietnam, China, Cambodia, Indonesia, Philippines, Taiwan | Monsoon Carbon/Envision | 36 | 52 | 94 | 53% | |||||
Carbon Trading Basic Introduction (for textile industry in China) | All core factories | China, Taiwan | IMPAQ | 27 | 34 | 48 | 59% | |||||
German Training Week – | Selected core factories | Vietnam | GIZ | 8 | 8 | 8 | 17% | |||||
|
|
|
|
|
|
|
| |||||
|
|
|
| |||||||||
* % of factories trained, calculated based on the total the factories in the scope for each subject matter training
To improve the awareness level of PUMA employees, we developed a foundational e-learning training module on climate action for all employees which is expected to be rolled out in the first half of 2024. In 2023, we launched phase 3 of Clean by Design (CbD) in the China-Taiwan region in partnership with Apparel Impact Institute (Aii) at two core Tier 1 and five core Tier 2 factories. We also kicked off a new resource efficiency programme called REF Programme at four core Tier 1 factories in Vietnam in partnership with ENERTEAM. In early 2024, we will launch an IFC cleaner production programme, called Decarbonization programme (CaDP) in Cambodia at three core Tier 1 and 1 core Tier 2 factories.
In addition to this, four Tier 1 and three Tier 2 factories participated in various rooftop solar projects in 2023.
The macroeconomic situation and overall uncertainty in the trade remained challenging during the first half of 2023. Recession fears in various markets, persistent high inflation and elevated interest rates led to muted consumer sentiment and volatile demand in retail. In addition, elevated inventory levels in the market contributed to a slower sell-in to the Wholesale channel. This created less demand from the markets, and we had to adjust our orders accordingly. This explains why we did not launch Renewable Energy programmes in 2023 to cover 76% sourcing volume of Tier 1, 75% sourcing volume of Tier 2, and cleaner production programme to cover 74% sourcing volume of Tier 1 and 75% sourcing volume of Tier 2, as reported in our 2022 annual report.
The values below represent annual savings from completed and ongoing projects (PaCT programme in Bangladesh, CbD programme in China, Indonesia, Vietnam) from 2019 until the end of 2023:
- Greenhouse gas reduction: 90,182 tCO2e per year
- Renewable energy: 247 MWp of RE capacity (including offsite wind) added in 2021, 2022 and 2023
- Water saving: 2,401,002 m3 per year
- Energy saving: 177,168 MWh per year
Cleaner Production programmes
Program/Partner | Scope | Number of factories* | % Sourcing volume (globally) | |
China-Taiwan | Clean-by-Design (CbD)/aii | Energy and water efficiency | T1: 3 |
|
Low Carbon Manufacturing Program (LCMP)/WWF | Energy and water efficiency | T1: 7 | ||
Bangladesh | Partnership for Cleaner Textile (PaCT)/IFC | Energy and water efficiency | T1: 6 | |
Vietnam - Cambodia | Clean-by-Design (CbD)/aii, FABRIC/GIZ | Energy and water efficiency, Coal phase-out | T1: 8 | |
MSMA | Energy and water efficiency | T1: 6 | ||
Greening Textile Program | Energy and water efficiency | T2: 2 | ||
Indonesia | Clean-by-Design (CbD)/aii | Energy and water efficiency | T1: 3 | |
Mexico** | Sustainable energy for all | Energy efficiency | T1; 2 | |
Total | T1: 35 | |||
|
|
|
|
|
* The number of factories represents completed and ongoing projects from 2019 until the end of 2023
↗ T.24 renewable energy PROGRAMMES
Programme/Partner | Scope | Number of factories* | % Sourcing volume (globally) | |
Vietnam/ Cambodia | Project Development Programme (PDP)/ GIZ | Rooftop Solar | T1: 7 | |
Self-initiative by factories | Rooftop Solar | T1: 5 | ||
Self-initiative by factories | iREC/DPPA pilot | T1: 4 | ||
China-Taiwan | Self-initiative by factories | Rooftop Solar | T1: 7 | |
Offsite wind, DPPA, iREC | T1: 11 | 2023 | ||
Bangladesh | Partnership for Cleaner Textile (PaCT)/IFC | Rooftop Solar | T1: 2 | |
Self-initiative by factories | Rooftop Solar | T1: 2 | ||
Project Development Programme (PDP)/ GIZ | Rooftop Solar | T1: 3 | To be enrolled in 2024 | |
Indonesia | Clean-by-Design(CbD)/aii | Rooftop Solar/ TIGR | T1: 3 | |
Pakistan | Project Development Programme (PDP)/ GIZ | Rooftop Solar | T1: 2 | |
Other (Argentina, Brazil, Mauritius, Philippines, Turkey) | iREC, Geothermal | T1: 3 | ||
Total | T1: 49 | |||
|
|
|
|
|
* The number of factories represents completed and ongoing projects from 2019 until the end of 2023
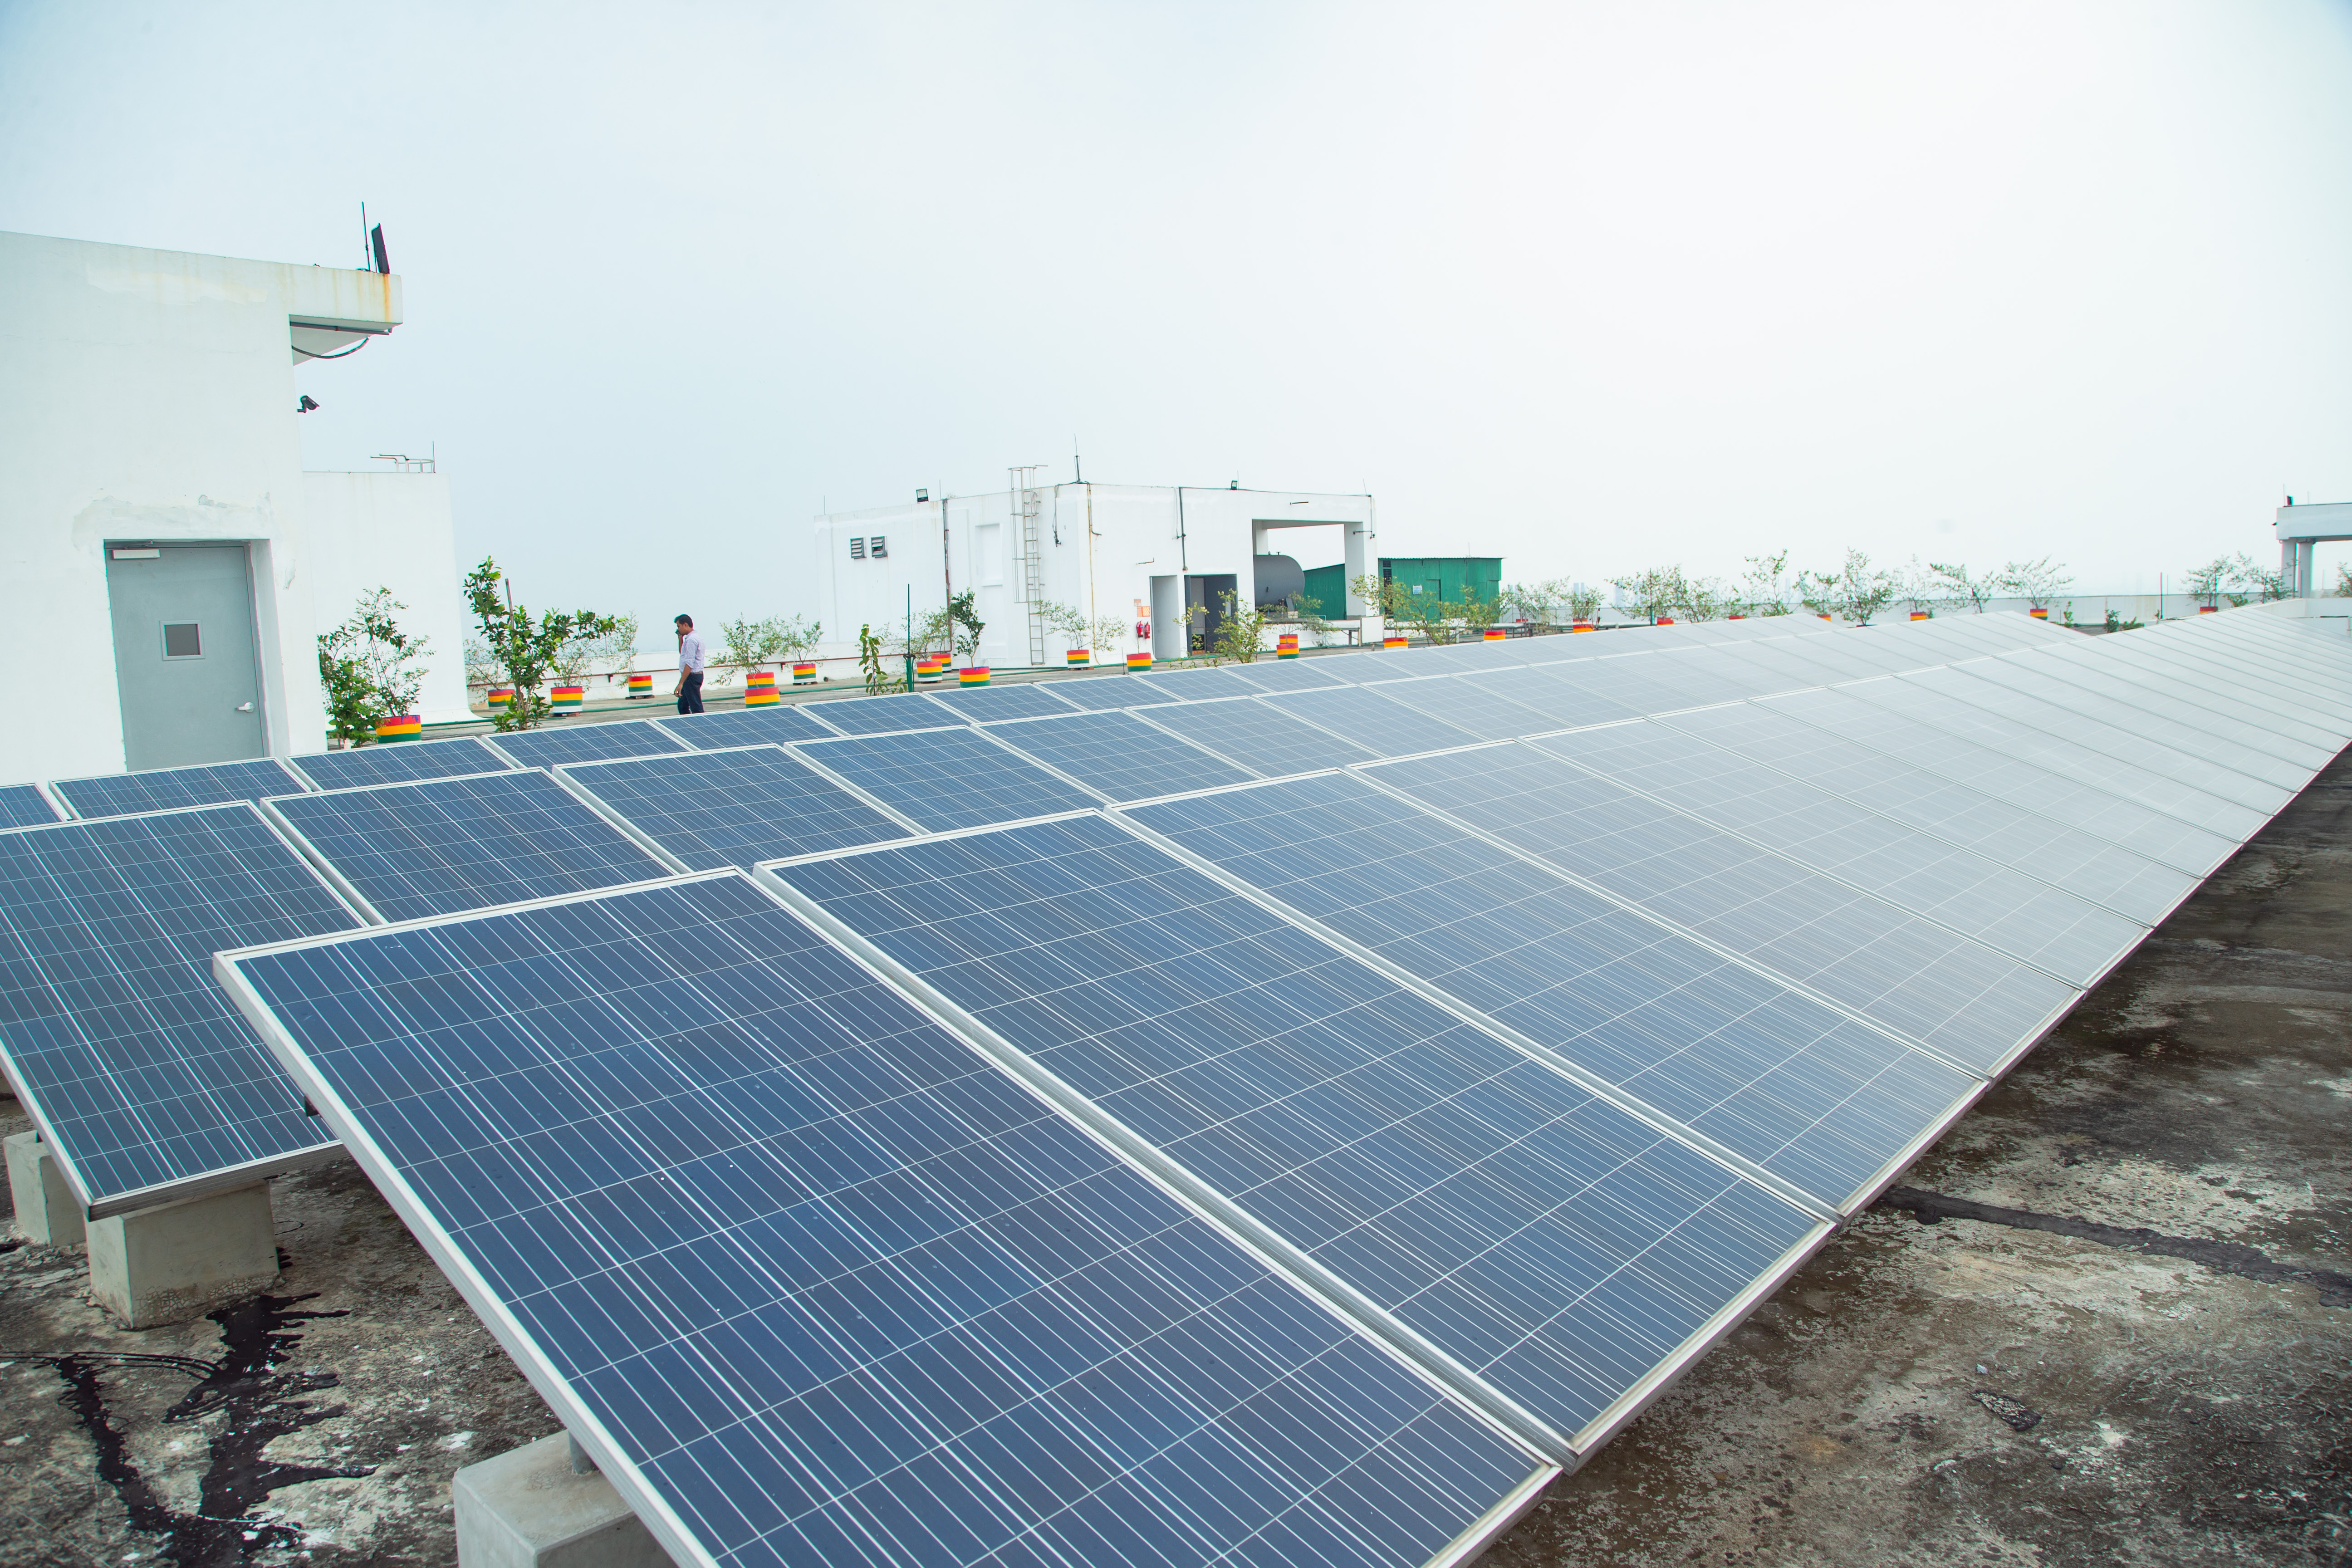
Rooftop solar panels from our suppliers in Bangladesh and Vietnam
Coal-Fired Boiler Phase-Out
We are committed to phasing out coal-fired boilers from our supply chain, mainly from the core Tier 1 and Tier 2 suppliers, by 2025. In 2022, we mapped our core suppliers and found that 21 of them have coal-fired boilers. In 2023, the number of core factories with coal fired boilers reduced to 17 due to revisions in the core factory list, out of which two factories have successfully phased out coal and 11 factories have partially replaced coal. In 2024, we plan to engage with remaining four factories which have not yet initiated the transition. We also plan to continue our tracking of factories which are under transition.
↗ G.16 COAL-FIRED BOILER PHASE OUT STATUS

In 2022 PUMA joined the Coal Phase Out Action Group under the UN’s Fashion Charter, with an objective to collaborate with other brands to expedite the phase-out of coal in our supply chain. We included a coal-fired boiler question in our on-boarding checklist for new factories in July 2022, to avoid on-boarding such factories with coal-fired boiler.
As a first step the brands have mapped their supply chain to identify supplier factories with coal fired boilers, and also identified the overlapping suppliers to prioritize these factories. GIZ joined this programme as an implementation partner and offered a coal phase-out pilot in Vietnam. This programme has a 10-step approach to realize coal phase out. Currently we are exploring options to partner with other brands to test the programme in our supply chain.
Coal phase-out In 2023, Chen Tai (Vietnam) Woven Tapes Enterprise Co., Ltd. successfully phased out the use of coal for its boiler by switching to rice husk biomass. Not only did this transition allow the facility to reduce their GHG emissions by 2,600 tCO2e, it also helped the facility to save 20% in fuel costs. |
Supplier Climate Targets
Science based targets are ambitious and difficult to achieve. Only large suppliers with capacity and top management commitment will be able to succeed. Those suppliers are identified through a readiness survey, climate investment study, long term business potential and in alignment with sourcing leaders. For the remaining suppliers, we plan to implement a simplified target setting system and hence an in-house tool is being developed for these suppliers.
In 2021, we developed two training modules for our core suppliers with the objective of driving climate target setting. One module focuses on the group of suppliers that need to establish science-based targets, and the other is aimed at the group of suppliers that needs to establish climate targets based on a simplified tool developed in-house.
In continuation of efforts made in 2021 regarding SBT for key suppliers, we conducted a climate investment survey for our top 20 suppliers and evaluated long-term business potential with them in alignment with our sourcing leaders. We evaluated their readiness level to set a SBT in future.
In 2023, we approached 21 selected supplier groups representing 40-50% of our business volume, to suggest them to set Science-Based Targets on company level (covering all of their factories including the ones not producing for PUMA). In March 2023 we kicked it off through a meeting, to go in detail through SBT process with the help of CDP. 19 out of these 21 suppliers agreed to set up SBT, one supplier declined, and one supplier already had an approved target. To encourage peer learning and to learn from industry experts we launched regular networking sessions on SBT. So far, we have completed two this year after the kickoff meeting in March. One supplier has already an SBT approved by SBTi, one has science-aligned targets (Scope 1 and 2) approved by World Resources Institute (WRI), nine suppliers are in process of getting SBT approved.
Supplier Leadership On Climate Transition (LOCT) Programme
In October 2023, we engaged with Guidehouse to launch a capacity development programme called Supplier Leadership On Climate Transition (LOCT). The programme provides a web-based platform to learn and implement a step-by-step approach for setting Science Based Targets and guidance on how to achieve those targets. So far, nine suppliers registered to join this programme in fall 2023. However, only eight suppliers joined, since one supplier selected a training available only after a supplier has set a SBT. This supplier will join the programme in 2024. We expect some other suppliers to join in early 2024.
Resource efficiency TST Group, which is one of our dyed fabrics suppliers, has implemented an innovative low-carbon coloration process, at its dyeing mills located in China and Cambodia. The supplier has installed advanced dyeing machines such as low liquor ratio dyeing machines, which require much less water than conventional dyeing machines. The factories also switched from batch to continuous pretreatment (preparation of fabric for dyeing) and continuous after-treatment (finishing of fabric) which are more efficient processes and hence consume less energy and water. These initiatives are estimated to reduce water usage by 70% and carbon footprint by 60% as compared to the conventional dyeing process in China. In Cambodia, it is estimated to reduce water usage by 40% and carbon footprint by 45% compared to the conventional process. TST has also gone for cold pad batch dyeing machines in its Chinese factory, which dye fabric in a cold condition, rather than in a heated condition in the conventional dyeing process. This technology, along with continuous pre-treatment and continuous after-treatment, is estimated to reduce water consumption by 75%, carbon footprint by 55% and chemical consumption by 90% compared to conventional dyeing process. The environmental benefit of these initiatives can be evidenced from water and energy data we collected. TST China’s GHG emissions are 54% lower, and the water consumption is 16% less than PUMA suppliers' average for textile mills. TST Cambodia’s GHG emissions are 50% lower and the water consumption is 10% less than PUMA suppliers’ average for the textile mills. Solar PV The Urmi Group, a renowned group of companies based in Bangladesh, has committed to reducing the greenhouse gas emissions from its business operations by 52.6% (intensity) by 2027 compared to the baseline year 2017. Therefore, Fakhruddin Textile Mills Ltd., one of the largest textile manufacturing units of the Urmi Group, installed roof-top solar panels in April 2022 and started to add renewable energy with a full design capacity of 2.5 MWp. As a result, solar PV is contributing to increasing the share of renewable energy and lessening GHG emissions into the atmosphere. In 2023, renewable electricity consumption accounted for 10% of the total electricity consumption (purchased & captive) of the factory. At the same time, the factory lowered its emissions by 1,216 tCO2e of greenhouse gas annually. |
Forest, Land and Agriculture (FLAG) emissions estimation
As required by the Science Based Target Initiative (SBTi), in 2023 we undertook a study to estimate the greenhouse gas emissions from the Forest, Land and Agriculture (FLAG) sector of our supply chain. The SBT requirement states that we need to set a target for FLAG emissions, if the FLAG-related emissions total 20% or more of our Scope 1, 2 and 3 emissions. PUMA engaged leading sustainability consultant Sphera to assess the FLAG footprint of our materials; the assessment indicates that FLAG emissions constitute 3% of the total emissions in 2022 and 4% in the baseline of 2017. Thus, there is no requirement for PUMA to set separate FLAG targets under SBT. Out of the total FLAG emissions cotton accounts for 55% of emissions followed by leather which contributes 26%.
↗ G.17 FLAG EMISSIONS

↗ T.25 flag EMISSIONS
2022 | 2017 | |
Total PUMA GHG emissions (Scope 1, 2 & 3)* | 1,975,535 | 1,836,272 |
Total FLAG emissions | 66,324 | 74,408 |
FLAG emissions % of total Scope 1, 2 & 3 | 3% | 4% |
|
|
|
*Emissions data contain further Scope 3 categories, e.g. the product use phase, which was not taken into account in the further Scope 3 considerations of this report, as PUMA has no influence on it
Scope 3 Category 1 Emissions
In 2023, we continued our assessment of Scope 3 emissions that come from PUMA’s indirect business activities, mainly in the supply chain, by lifecycle expert company Sphera in line with the Greenhouse Gas Protocol.
As in 2022, they conducted a comprehensive assessment of our supply chain emissions beyond Tier 1 manufacturing, including Tier 2 manufacturing of fabrics and components, estimated emissions from Tier 3 suppliers and material production using emission factors from their LCA database known as the GaBi database.
2023 | 2022 | 2021 | 2020 | 2019 | 2018 | 2017 | % Change | |
Absolute GHG emissions (tCO2 eq) | 991,864 | 1,278,758 | 1,242,468 | 1,389,335 | 1,631,904 | 1,484,935 | 1,409,265 | -30% |
|
|
|
|
|
|
|
|
|
1The values for November and December 2023 were estimated by employing the Exponential Smoothing (ETS) algorithm in Microsoft Excel, utilizing data from January to October of 2023. This approach was chosen after comparing it to alternative methods, considering its performance against actual historical data, specifically in terms of deviation from the actual values in percentage terms. The ETS method displayed both higher accuracy and higher precision compared to other methods, such as averaging the last 10/12 months or multiplying the estimated production by the average KPI (per production unit) from the 12 months of data spanning from November 2021 to October 2022.
Note: Scope 3 category 1 estimation includes GHG emissions associated with goods and services purchased by PUMA from its suppliers related to PUMA products and associated packaging. This excludes emissions associated with other goods and services acquired by PUMA offices, stores and warehouses.
We can see that our absolute Scope 3 emissions from the purchased goods and services category have decreased by 30% from 2017 to 2023, while material consumption has in increased by 10% during the same period.
In view of the global macroeconomic situation, which has led to a change in customers' ordering behaviour, and the normalisation of the supply chain, we saw a decline in the order book in the first half of the year and stabilisation during the second half, with a return to the pre-pandemic ordering practices. Therefore, we actively adjusted sourcing activities respectively and continued to provide transparency to our sourcing partners so they can adjust their capacities accordingly. This explains why material consumption and energy consumption decreased compared with 2022. This contributed to our absolute greenhouse gas emission reduction, alongside energy efficiency improvements and the increased use of renewable electricity at a factory level, as well as the usage of more sustainable materials.
Scope 3 Category 1 emissions mainly originate from two sources; the raw materials and the energy consumed by our core Tier 1, Tier 2, Tier 3 (production of raw material) suppliers to produce finished materials and components as well as finished goods. A breakdown of total GHG emissions by source is presented below.
↗ G.18 GHG EMISSIONS BY SOURCE

Carbon footprint at a supply chain level
Looking deeper into the emissions from our supply chain, we see that absolute GHG emissions from Tier 1 and Tier 2 suppliers were 3% lower in 2023 than in 2017. 65% of greenhouse gas emissions are coming from Tier 2 factories while 35% of emissions are contributed by Tier 1 factories. Drilling down into product divisions, we can see that the Tier 2 textile/fabric mills contribute a maximum of 61% followed by Tier 1 footwear factories with 26%. This is mainly due to the higher energy footprint of Tier 2 textile wet processing units. Further analysis indicates that absolute emissions from Textile Tier 2 factories have increased by 18% while the production of textile/fabric for PUMA factories has increased by 23% in 2023 as compared to 2017. The absolute emissions from Footwear Tier 1 factories have reduced by 17% in 2023 as compared to 2017, while the PUMA production from Tier 1 Footwear factories has increased by 31%. This was achieved due to the participation of these factories in cleaner production, renewable energy programmes and the purchase of iRECs.
Absolute GHG emissions from Tier 3 suppliers in 2023 saw a marginal increase of 0.3% compared to 2017. A closer look at the data indicates that this marginal increase in absolute emissions from Tier 3 suppliers is mainly due to a rise in the consumption of polyester and polyurethane during this period. Polyester and polyurethane together increased by 27% in 2023 as compared to 2017; this was mainly due to an increase in sourcing volume but also because our material data quality and accuracy has improved since 2021.
We see opportunities to further scale up cleaner production and renewable energy programmes to more Tier 1 and Tier 2 suppliers, and also to launch them at some of the spinners (Tier 3).
In 2023, we mapped our core Tier 3 spinning mills for the Apparel division through our core Tier 1 and Tier 2 suppliers. We could identify 20 spinning mills. We collected yarn volume supply for PUMA production in 2022 for 19 mills. These 19 factories represented 25.8% of our total volume of yarns sourced in 2022. The objective was to engage these factories to collect primary energy data from Tier 3 suppliers to calculate greenhouse gas Scope 3 emissions rather than estimating the emissions from Tier 3 factories by using raw material data and subsequently to engage them on cleaner production and renewable energy programmes. We provided training to these Tier 3 suppliers on energy data questionnaires and asked them to provide the data. However, we faced many challenges, including a lack of willingness on the part of these Tier 3 suppliers to provide energy data and supporting documents.
Only eight factories submitted data. Out of these eight factories only three factories’ data could be validated. The remaining five factories did not provide supporting documents. In coming years, we will continue to encourage these suppliers to submit their data. The 2023 Tier 3 emissions are estimated by Sphera using its GaBi database.
2023 | 2022 | 2021 | 2020 | 2019 | 2018 | 2017 | % Change 2022/2023 | % Change 2017/2023 | |
Absolute GHG emissions from Tier 1 and Tier 2 suppliers (t CO2e) | 334,123 | 423,762 | 358,508 | 297,573 | 371,420 | 382,043 | 345,361 | -21% | -3% |
Tier 3 suppliers (t CO2e) | 252,918 | 305,869 | 284,215 | 223,909 | 258,425 | 193,193 | 252,251 | -17% | 0.3% |
|
|
|
|
|
|
|
|
|
|
1The values for November and December 2023 were estimated by employing the Exponential Smoothing (ETS) algorithm in Microsoft Excel, utilizing data from January to October of 2023. This approach was chosen after comparing it to alternative methods, considering its performance against actual historical data, specifically in terms of deviation from the actual values in percentage terms. The ETS method displayed both higher accuracy and higher precision compared to other methods, such as averaging the last 10/12 months or multiplying the estimated production by the average KPI (per production unit) from the 12 months of data spanning from November 2021 to October 2022.
Note: Tier 1 & Tier 2 emissions are estimated based on actual energy consumption collected from core Tier 1 and Tier 2 factories and extrapolated to cover all Tier 1 and Tier 2 supplier factories. Tier 3 emissions are estimated by Sphera by using its GaBi database.
↗ G.19 GHG Contribution by Product Division1-2

1Tier 1: Apparel, Footwear & Accessories factories
2Tier 2: Leather, textile, polyurethane factories
Proportion of production powered by coal
Out of the various product divisions, currently coal is only used in leather and textile production. For leather, around 24% of PUMA production is powered by coal, of which 7.6% in China and 17.0% in Vietnam. For textile, around 43% of PUMA production is powered by coal. Vietnam contributes the most with 31.8%; the remaining percentage is shared between Cambodia, China, Taiwan and Turkey. Aligning with PUMA strategies, all suppliers that are still using coal for their production have set targets and plan to phase out coal.
↗ T.28 Percentage of production powered by coal (core tier 2)1
China | Vietnam | Total | ||||
Tier 2 - Leather* | 7.6% | 17.0% | 24.6% | |||
|
|
|
|
|
|
|
Cambodia | China | Taiwan | Turkey | Vietnam | Total | |
Tier 2 | 3.6% | 1.7% | 2.3% | 3.8% | 31.8% | 43.2% |
|
|
|
|
|
|
|
*Core Tier 2 Leather: 5 factories
**Core Tier 2 Textile: 32 factories
1The values for November and December 2023 were estimated by employing the Exponential Smoothing (ETS) algorithm in Microsoft Excel, utilizing data from January to October of 2023. This approach was chosen after comparing it to alternative methods, considering its performance against actual historical data, specifically in terms of deviation from the actual values in percentage terms. The ETS method displayed both higher accuracy and higher precision compared to other methods, such as averaging the last 10/12 months or multiplying the estimated production by the average KPI (per production unit) from the 12 months of data spanning from November 2021 to October 2022.
Carbon Footprint At A Raw Material Level
Absolute GHG emissions from raw material consumption fell by 50% even as total material consumption increased by 10% since 2017. This was achieved due to our continuous endeavour to shift towards more sustainable materials and other measures. More sustainable cotton and polyester increased from 40% and 47% in 2017 to 99.2% and 85% respectively in 2023. In view of the global macroeconomic situation, which has led to a change in customers' ordering behaviour, and the normalisation of the supply chain, we saw a decline in the order book in the first half of the year and stabilisation during the second half. This explains why material consumption decreased compared with 2022.
2023 | 2022 | 2021 | 2020 | 2019 | 2018 | 2017 | % Change | % Change | |
Total raw materials (t) | 174,390 | 200,514 | 187,101 | 195,039 | 200,936 | 179,995 | 158,509 | -13% | 10% |
GHG emission from materials (tCO2e) | 404,822 | 549,127 | 599,849 | 867,853 | 1,002,059 | 549,127 | 811,654 | -26% | -50% |
|
|
|
|
|
|
|
|
|
|
1Assumptions: During the Scope 3 assessment, it was observed that material data collection has improved over time and that, since 2021, we have been able to capture the material data comprehensively. For example, 2017, material data was not available for all types of materials and some material data were incomplete. In the absence of comprehensive raw material data for 2017, material data was extrapolated from 2020. Furthermore, we observed that the polyester consumption data for footwear was exceptionally high for 2020 and possibly erroneously overestimated. Therefore, the polyester data for footwear for 2017 and 2020 was extrapolated from 2019 data.
A breakdown analysis as shown in the following chart indicates that polyurethane (23%) contributes the most, followed by leather (18%) and polyester (17%). The share of rubber has significantly reduced from 33% in 2017 to 15% in 2023, mainly due to a reduction in rubber consumption during the same period, while the share of polyurethane has significantly increased from 7% in 2017 to 23% in 2023, and polyester’s share has increased from 12% to 17% mainly due to significant increase in polyurethane and polyester consumption during the same period. The share of leather has fallen from 21% in 2017 to 18% in in 2023. This is due to a combination of strategies to replace leather with polyurethane and textile and the improved capture of leather data in 2023, as we collected suede leather and grain leather data separately and suede leather has a lower carbon footprint than full grain leather.
The analysis for 2023 indicates that we need to focus more on sustainable alternatives for polyurethane, polyester, leather and synthetic rubber.
↗ G.20 GHG CONTRIBUTIONS BY MATERIALS1-2

1Other include: acrylic, linen, lycra, metals, adhesives, etc.
2Leather is natural leather while polyurethane is imitation leather, also known as synthetic leather
↗ G.21 ENERGY AND WATER CONSUMPTION AT RAW MATERIAL LEVEL

↗ T.30 ENERGY AND WATER CONSUMPTION AT RAW MATERIAL LEVEL
Water Consumption (m3) | Energy Consumption (GJ) | |
Cotton | 30,115,148 | 255,981 |
Leather | 2,824,342 | 935,920 |
Polyester | 5,253,305 | 1,950,459 |
Plastic packaging | 7,520 | 18,543 |
Rubber | 684,179 | 2,338,201 |
EVA | 282,703 | 1,239,101 |
Polyurethane | 495,391 | 1,977,494 |
Paper packaging | 77,727 | 143,537 |
Others | 1,793,769 | 469,798 |
|
|
|
In 2023, we evaluated the energy and water footprint at a raw material level. The results indicates that the energy footprint of rubber is the highest (25.1%) followed by polyurethane (21.2%) and polyester (20.9%). When it comes to water cotton has the highest share (72.5%) followed by polyester (12.6%). We intend to use this analysis for material selection purposes to reduce the energy and water footprint of our products.
Renewable Energy
In line with our 10FOR25 target to achieve a 25% share of renewable energy for core Tier 1 and Tier 2 suppliers, we have set a goal of 15% renewable energy share for 2023. The share of renewable energy consumption by Tier 1 suppliers increased from 11.3% in 2022 to 23.1% in 2023 and Tier 2 suppliers increased from 10.8% in 2022 to 21.7% in 2023. The increase in both tiers therefore has helped PUMA to reach an overall share of renewable energy of 22.1% in 2023, greatly exceeding our target. This was mainly achieved due to the participation of the core suppliers in renewable energy projects, followed by the installation of rooftop solar facilities, switching from coal to biomass and the purchase of energy attribute certificates by both core Tier 1 and Tier 2 suppliers.
2023 | 2022 | 2021 | 2020 | 2019 | 2018 | 2017 | % Change 2020/2023 | |
PUMA production (Core Tier 1)* | ||||||||
Non-renewable energy consumption from PUMA production (Core Tier 1) | 201,553 | 292,459 | 331,199 | 221,641 | 246,160 | 195,866 | 194,881 | -9.1% |
Renewable energy consumption from PUMA production (Core Tier 1) | 60,662 | 37,322 | 17,763 | 3,013 | 294 | 1,913.0% | ||
Percentage of renewable energy consumption from PUMA production (Core Tier 1) | 23.1% | 11.3% | 5.0% | 1.0% | 0.2% | 1,625.0% | ||
PUMA production (Core Tier 2)** | ||||||||
Non-renewable energy consumption from PUMA production (Core Tier 2) | 611,238 | 744,940 | 795,673 | 607,310 | 586,986 | 0.6% | ||
Renewable energy consumption from PUMA production (Core Tier 2) | 169,655 | 90,333 | 39,317 | 3,393 | 524 | 4,901.0% | ||
Percentage of renewable energy consumption from PUMA production (Core Tier 2) | 21.7% | 10.8% | 5.0% | 0.6% | 0.1% | 3,811.0% | ||
PUMA production (Core Tier 1 and 2) | ||||||||
Non-renewable energy consumption from PUMA production (Core Tier 1 and 2) | 812,792 | 1,037,399 | 1,126,872 | 828,951 | 246,160 | 195,866 | 781,867 | -1.9% |
Renewable energy consumption from PUMA production (Core Tier 1 and 2) | 230,317 | 127,655 | 57,080 | 6,406 | - | 818 | 3,496.0% | |
Percentage of renewable energy consumption from PUMA production (Core Tier 1 and 2) | 22.1% | 11.0% | 4.8% | 0.8% | 0.1% | 2,779.0% | ||
|
|
|
|
|
|
|
|
|
* Core Tier 1 supplier factories Apparel, Footwear and Accessories (62 factories))
**Core Tier 2 supplier factories Leather, PU and Textiles (40 factories)
1Data includes extrapolations or estimations where no real data could be provided. The values for November and December 2023 were estimated by employing the Exponential Smoothing (ETS) algorithm in Microsoft Excel, utilizing data from January to October of 2023. This approach was chosen after comparing it to alternative methods, considering its performance against actual historical data, specifically in terms of deviation from the actual values in percentage terms. The ETS method displayed both higher accuracy and higher precision compared to other methods, such as averaging the last 10/12 months or multiplying the estimated production by the average KPI (per production unit) from the 12 months of data spanning from November 2021 to October 2022.
Renewable electricity
The share of renewable electricity sourcing by Tier 1 and Tier 2 suppliers has increased from 0.35% in 2017 to 27.4% in 2023. Looking at the Tiers in the value chain, the share of renewable electricity has increased from 0.18% in 2017 to 18.0% in 2023 by Tier 1 suppliers, while it has increased from 0.74% to a significant 47.2% for Tier 2 suppliers during the same period including the purchase of RECs by suppliers.
This progress is achieved due to publicly disclosed 2025 goals on renewable energy, one-to-one follow-up meetings with the suppliers, the participation of factories in renewable energy programmes which led to the installation of roof-top solar PV and the purchase of RECs. Support from the Sourcing department has played a major role in engaging with our core suppliers.
2023 | 2022 | 2021 | 2020 | 2017 | % Change | % Change | |
Total renewable | 91,246,157 | 64,624,534 | 14,494,042 | 3,588,937 | 817,644 | 41% | 11060% |
Total grid electricity | 241,651,096 | 333,408,508 | 324,910,084 | 252,665,750 | 234,323,351 | -28% | 3% |
Share of renewable electricity | 27.4% | 16.24% | 4.30% | 1.40% | 0.35% | 69% | 7783% |
T-1 renewable | 40,660,939 | 13,695,766 | 11,149,103 | 1,999,458 | 298,283 | 197% | 13532% |
T-1 grid electricity | 185,115,917 | 266,321,305 | 218,804,548 | 169,593,745 | 164,904,224 | -30% | 12% |
Share of renewable electricity (T-1) | 18.0% | 4.89% | 4.80% | 1.17% | 0.18% | 268% | 9874% |
T-2 renewable | 50,585,218 | 50,928,768 | 3,344,939 | 1,589,479 | 519,361 | -1% | 9640% |
T-2 grid electricity | 56,535,179 | 67,087,203 | 106,105,536 | 83,072,005 | 69,419,127 | -16% | -19% |
Share of renewable electricity (T-2) | 47.2% | 43.15% | 3.10% | 1.88% | 0.74% | 9% | 6259% |
|
|
|
|
|
|
|
|
1The values for November and December 2023 were estimated by employing the Exponential Smoothing (ETS) algorithm in Microsoft Excel, utilizing data from January to October of 2023. This approach was chosen after comparing it to alternative methods, considering its performance against actual historical data, specifically in terms of deviation from the actual values in percentage terms. The ETS method displayed both higher accuracy and higher precision compared to other methods, such as averaging the last 10/12 months or multiplying the estimated production by the average KPI (per production unit) from the 12 months of data spanning from November 2021 to October 2022.
2The total electricity does not include captive electricity generation from fossil fuels such as Natural Gas, Diesel etc.
3The renewable energy includes iREC certificates purchased by core leather, polyurethane, textile factories in the year 2023, but excludes renewable energy sourced by the Tier 2 core factories e.g., packaging and labelling, trims, footwear bottom and knitted uppers.
Policy Advocacy
As a part of Policy Engagement working group under Fashion Industry Charter for Climate Action. In 2023, the UNFCCC organised a policy dialogue event with stakeholders in Bangladesh. The purpose of this policy dialogue was to initiate an inclusive but focused discussion among key stakeholders in the fashion sector about how to jointly effect the required changes, identify actions that can be taken in the near-term future to accelerate renewable energy, support scaling renewable energy solutions, and connect existing efforts on the ground with best practice case studies.
PUMA participated in this policy dialogue event on February 27th, 2023, along with other brands. The key outcomes were:
- The government of Bangladesh remains committed to accelerating transition to renewables.
- Discussions were focused on exploring direct Power Purchase Agreements (PPAs) as a solution for transiting to renewable energy in Bangladesh.
- The need for fiscal and tax incentives, including upgrade of tariffs were identified as key required policy interventions.
- Opportunities to identify financing for renewable energy were another key aspect which needs to be explore.
GREENHOUSE GAS EMISSIONS FROM THE TRANSPORT OF GOODS
PUMA’s Logistics Team has been working on reducing greenhouse gas emissions from the transport of goods for several years. Key measures include the optimisation of container loads, as well as reducing airfreight to an absolute minimum. Air freight reduction is also part of PUMA’s annual bonus targets.
2023 brought progress in several areas:
- We managed to further reduce our airfreight ratio to 0.3%, meaning that only 0.3% of all PUMA goods (by unit) are transported by air. This is a significant reduction compared to 2019 (before the COVID-19 pandemic) where the value was close to 3%.
- Together with our main logistics service provider Maersk, we've integrated biofuels into our marine shipments as part of Maersk’s eco-friendly shipping initiative. Since February 2023, the utilisation of biofuels for transporting goods from our manufacturing sites to the European market has resulted in an impressive 84.6% reduction in GHG emissions along these routes.
- Our logistics team in the USA was able to expand the use of electric trucks from one to three trucks for the transport of PUMA goods between the port in Los Angeles and the warehouse in Torrance. We anticipate that more electric trucks will follow in other countries over the next years.

An electric truck operates at PUMA’s warehouse in California, USA
↗ G.22 Share of GHG emissions BY transport mode in 2019 and 2023

2023 | 2022 | 2021 | 2019 | |
Road freight | 33,665 | 48,345 | 38,815 | 24,522 |
Rail freight | 2,103 | 675 | 3,153 | 1,013 |
Sea freight | 25,070 | 45,891 | 44,698 | 19,830 |
Air freight | 6,864 | 29,751 | 17,731 | 58,651 |
|
|
|
|
|
The graph and table above illustrate the relative downturn in the use of air freight compared to other modes of transport. Our airfreight reduction target helped us reduce the share of emissions from airfreight from
56.4% in 2019 to 10.1% in 2023.