Environmental Key Performance Data
Г
The PUMA Environmental Profit and Loss Account, or EP&L, calculates the environmental impact of PUMA's activities in financial terms across six categories from raw material production to the PUMA store. While the EP&L is not a precise measurement tool, it helps to show the categories and stages of the value chain in which the impact is greatest and therefore gives a good indication of where we should focus our efforts.
The EP&L methodology, was developed in 2011 by PWC and Truecost, and later refined by Kering with the help of PWC. It mainly relies on material input and spending data.
Over the last years, we have added primary data for our Tier 1 and Tier 2 suppliers and developed specific EP&L emission factors for major materials used, such as Better Cotton.
However, we are still in the process of fully aligning our EP&L methodology for Tiers 3 and 4 with internal and external standards. As a result, the table below differs from our Scope 3 emission calculation in the Climate section and also results in a high water value for Tier 3 due to some wet processing for leather and polyester being attributed to Tier 3.
We will continue to work on the alignment of methodologies to strengthen the EP&L as a valuable risk assessment and information tool.
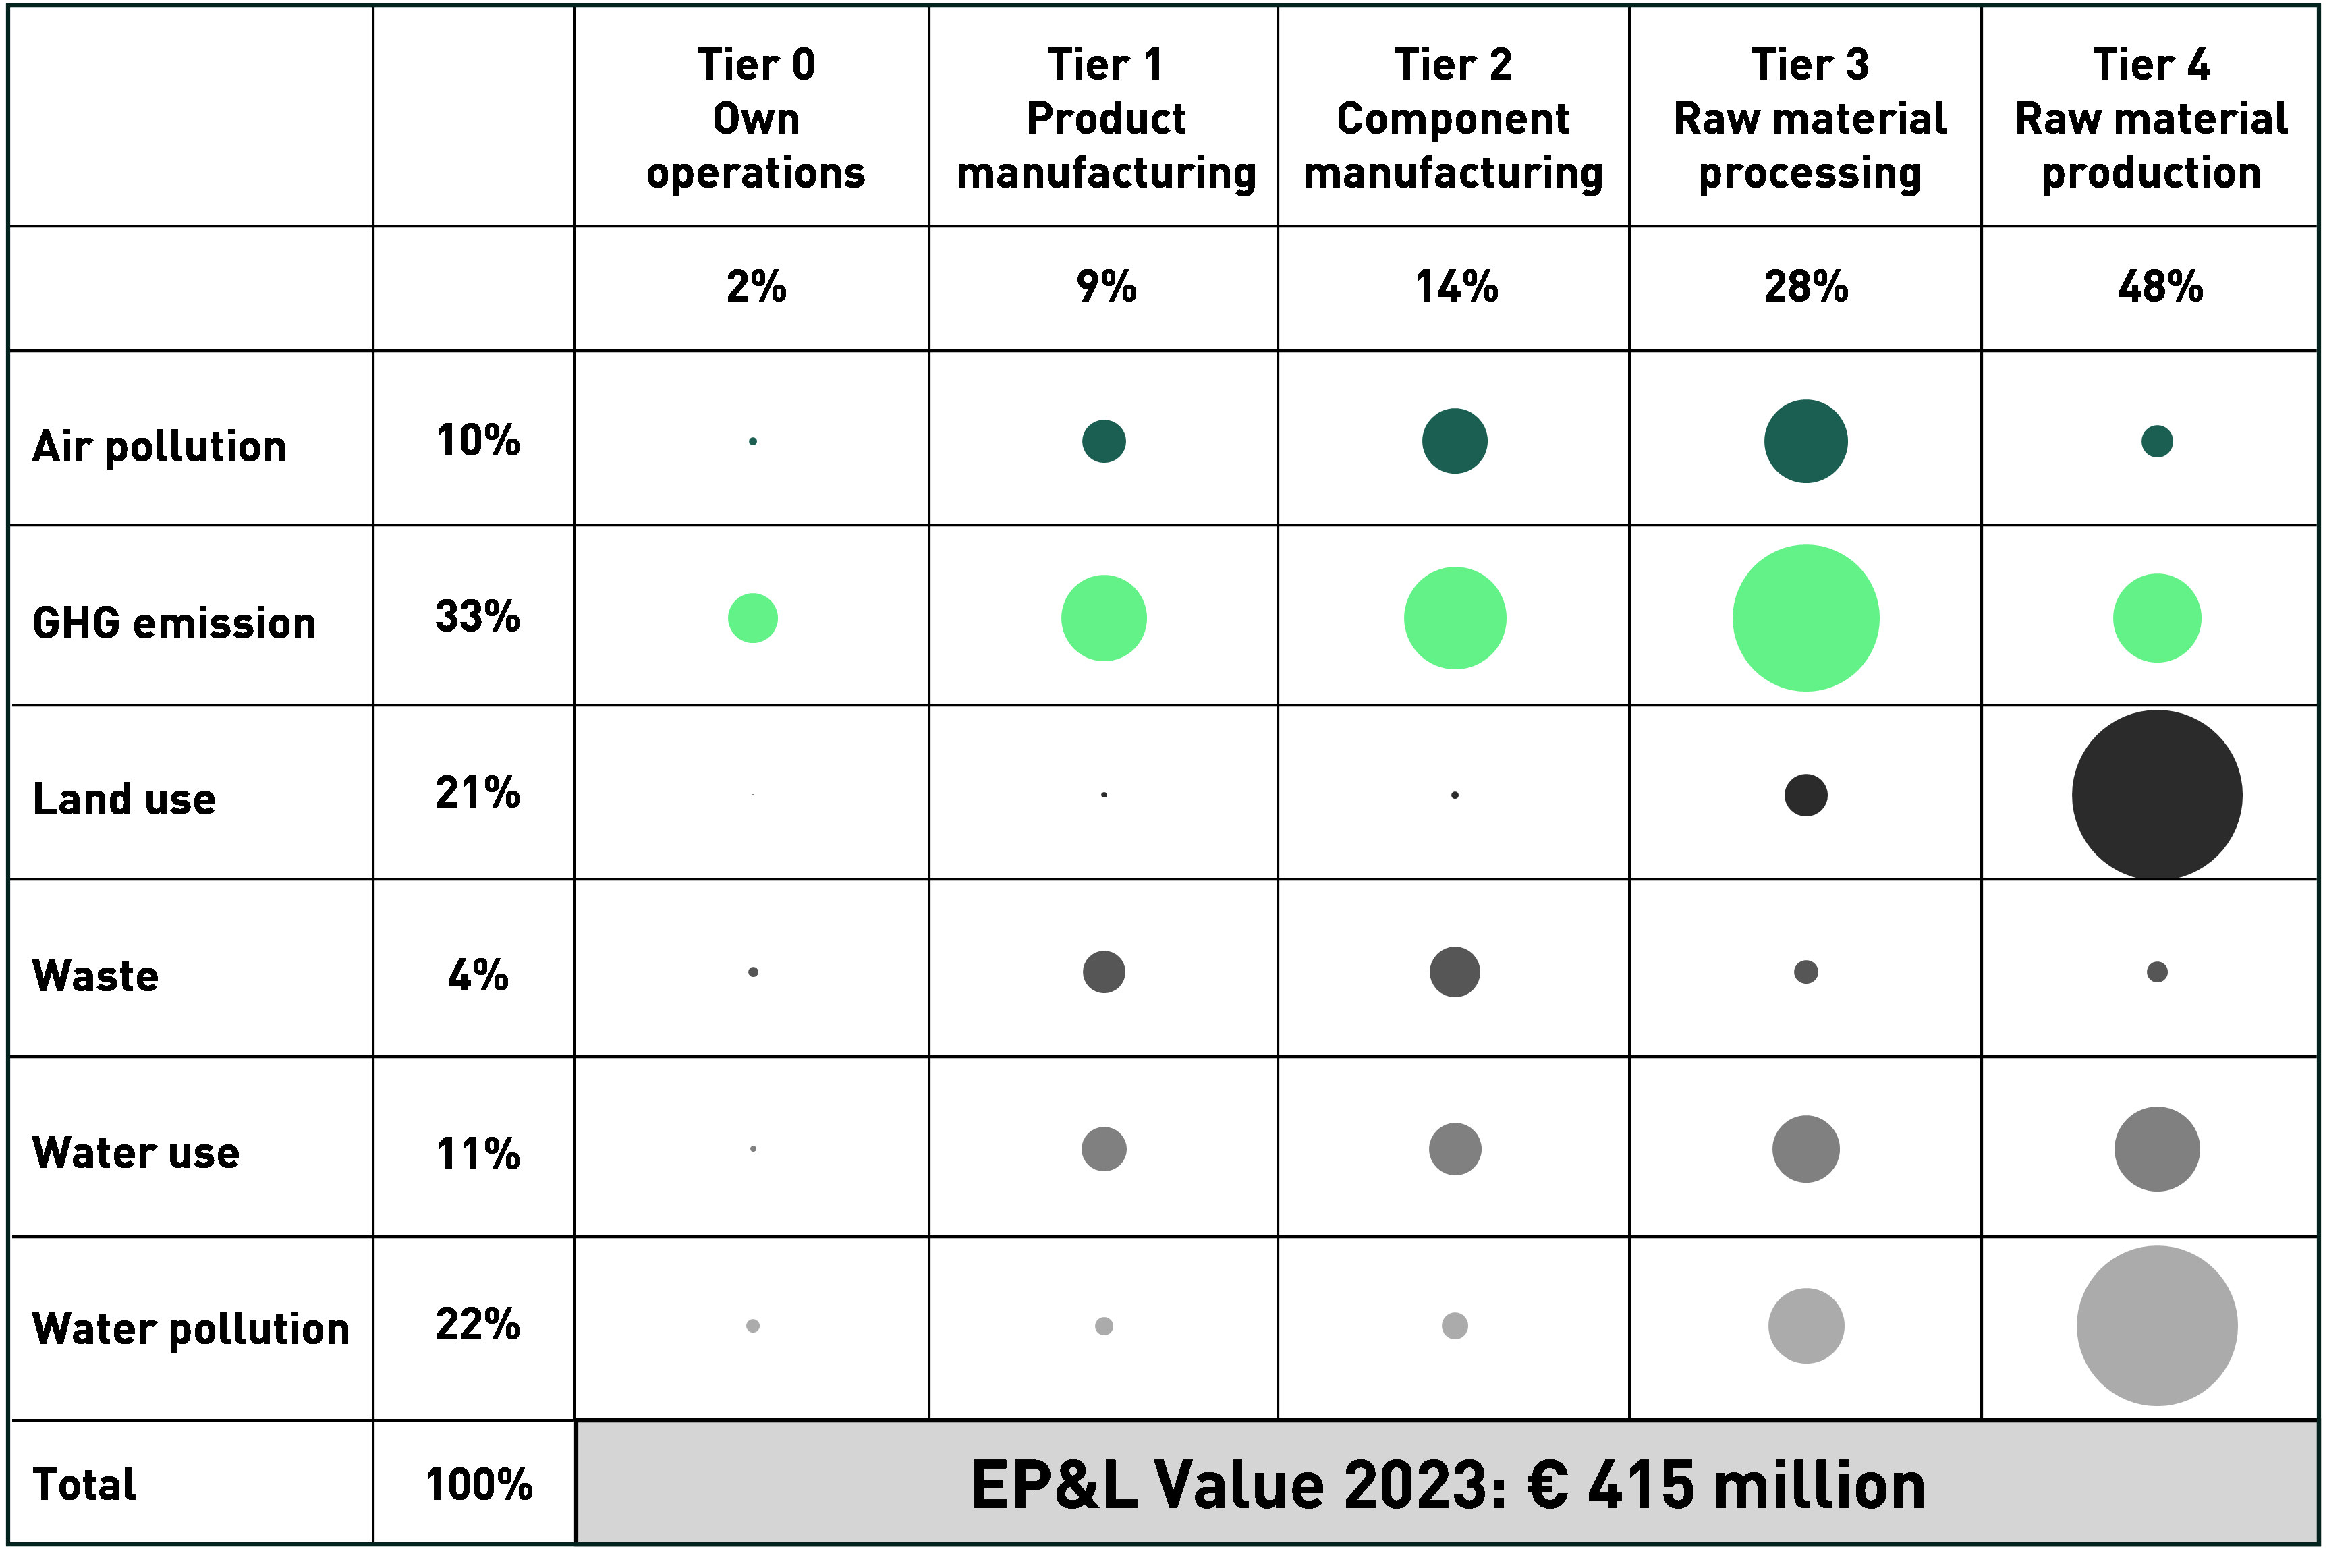
↗ G.36 EP&L RESULTS 2023
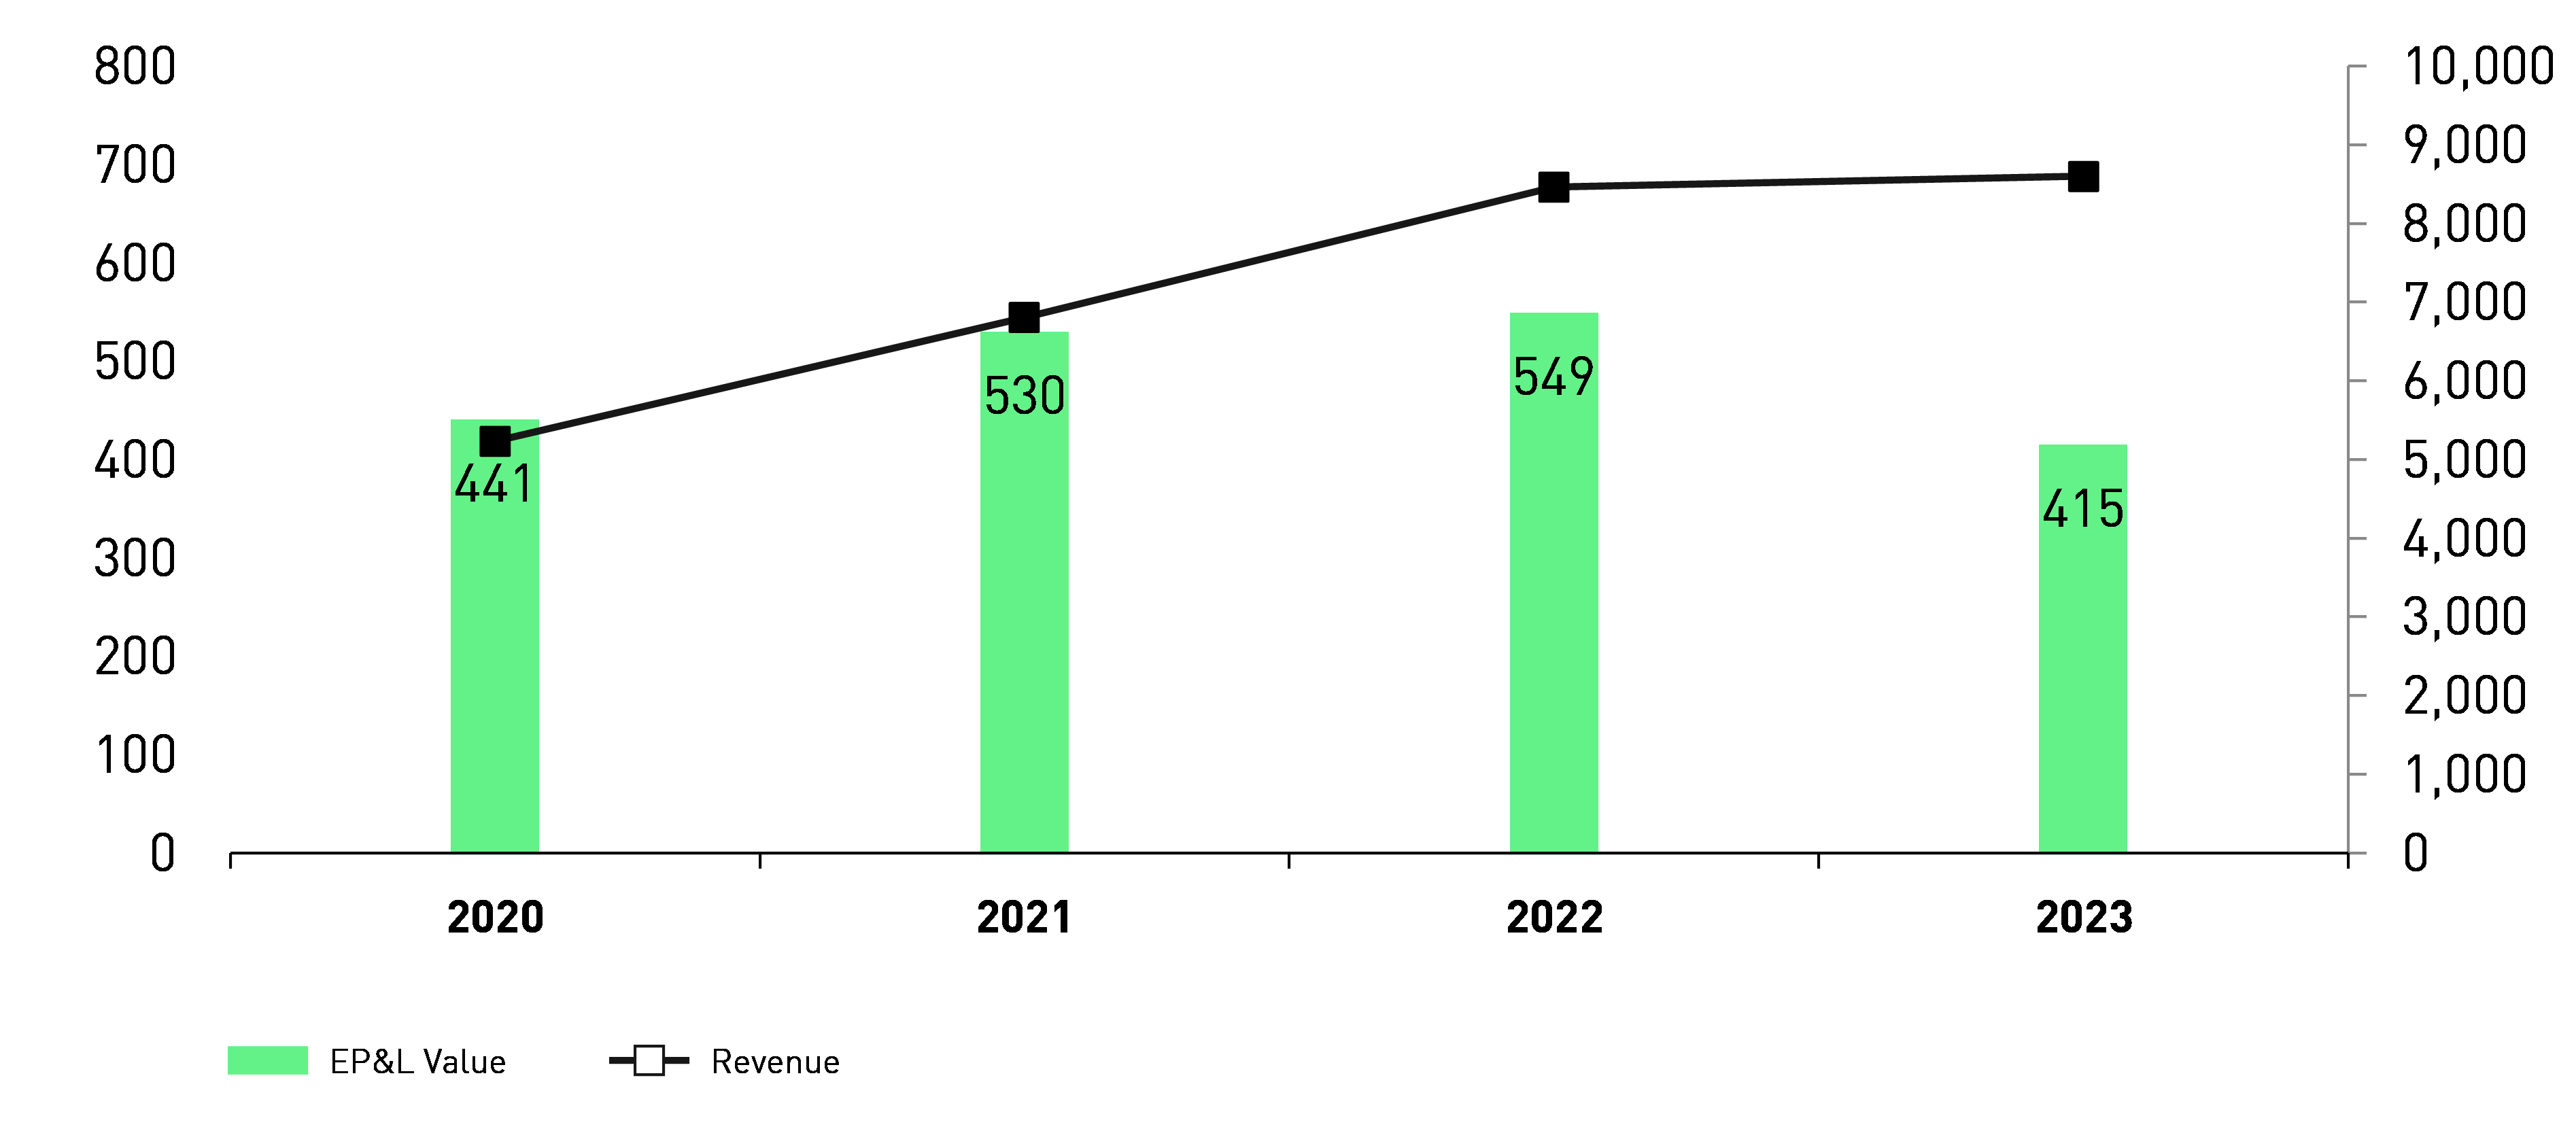
↗ G.37 EP&L TREND 2020 – 2023
From our EP&L results, we can conclude that the production (48%) and processing of raw materials (28%) is responsible for the vast majority of the environmental impact from a process point of view, while greenhouse gas emissions (33%), water pollution (22%) and land use (21%) are responsible for over half of all environmental impact measured by the EP&L in terms of impact categories.
This confirms our strategy of transitioning to the use of low-impact materials at scale, while focusing on the reduction of greenhouse gas emissions across our supply chain.
The EP&L trend over the last years shows that the EP&L value is growing slower than sales. This means that while the overall impact was growing, we were able to reduce the EP&L value relative to sales. In 2023, we achieved an absolute reduction.
└
Product/material-related E-KPIs
We have been measuring the average environmental key performance indicators (E-KPIs) from Textile and Leather manufacturing (Tier 2) and Apparel and Footwear manufacturing (Tier 1) since 2017.
In 2023, the Greenhouse Gas emissions KPIs reduced across the product divisions, both Tier 1 and Tier 2, except for the footwear division, where it almost remained stable (increase by 0.2%) as compared to 2020. CO2 emissions per piece of garment reduced by 23.2%; per square metre of leather produced, CO2 emissions have reduced by 40.7% and per ton of textile produced, CO2 emissions reduced by 9.2%. This was mainly achieved due to various climate actions initiated as described in the report. The participation of core suppliers in cleaner production and renewable energy programmes, installation of rooftop solar projects, switching from coal to biomass, and the purchase of RECs are the main contributor for these reductions achieved in Greenhouse Gas emissions.
In 2023, water consumption per pair/square metre reduced for footwear by 21.5% and 4.9% for textile as compared to the baseline of 2020 mainly due to the implementation of water efficiency measures including water recycling plants by a few textile mills towards the end of 2022.
However, the water KPI increased for apparel by 9.4%, and for leather by 11.7%. For apparel, production reduced by 15% as compared to 2020 (which is 33% reduction from 2022). Most of the apparel factories use water for domestic purposes and hence water consumption depends on the number of workers. In 2023, the market environment and increased inventory levels resulted in a need for more cautious procurement from our suppliers, so the number of workers in core apparel factories decreased by 9% and production fell by 15% resulting in higher water consumption per piece of apparel as compared to 2020.
Out of five leather factories, two were new core factories and have not participated in resource efficiency programmes. One of the tanneries in China has relatively high water consumption as they process raw hide in-house, whereas other leather tanneries process wet blue leather (tanned leather, but not dried, dyed nor finished). Also, one tannery in Vietnam started tracking and reporting rainwater usage in 2023.
In 2023, production waste to landfills decreased by 87.4% for apparel and by 64.7% for the footwear division as compared to the 2020 baseline. This is mainly due to the adoption of better waste disposal practices by our suppliers and being able to achieve diversion from landfill. We also observed that factories were able to track and report waste data more accurately.
2023 | 2022 | 2021 | 2020 | 2019 | 2018 | 2017 | Change 2020-2023 | Number of suppliers | |
Energy/pair (kWh) | 1.63 | 1.36 | 1.41 | 1.31 | 1.30 | 1.25 | 1.40 | 24.8% | 21 |
CO2/pair (kg) | 0.75 | 0.7 | 0.68 | 0.74 | 0.96 | 0.93 | 1.00 | 0.2% | |
Water/pair (L) | 11.8 | 9.6 | 11.9 | 15.1 | 15.2 | 12.3 | 14.5 | -21.5% | |
Waste/pair (g) | 122 | 134 | 141 | 145 | 127 | 109 | 116 | -15.6% | |
Waste to landfills/pair (g) | 8.36 | 12.3 | 19.0 | 23.7 | - | - | - | -64.7% | |
|
|
|
|
|
|
|
|
|
|
2023 | 2022 | 2021 | 2020 | 2019 | 2018 | 2017 | Change 2020-2023 | Number of factories | |
Energy/piece (kWh) | 0.58 | 0.52 | 0.55 | 0.56 | 0.57 | 0.57 | 0.72 | 4.5% | 19 |
CO2/piece (kg) | 0.17 | 0.19 | 0.20 | 0.22 | 0.24 | 0.26 | 0.31 | -23.2% | |
Water/piece (l) | 5.03 | 3.83 | 4.23 | 4.60 | 4.39 | 4.20 | 7.58 | 9.4% | |
Waste/piece (g) | 60.7 | 58.2 | 62.3 | 54.3 | 56.3 | 46.5 | 44.0 | 11.8% | |
Waste to landfills/piece (g) | 0.33 | 2.66 | 2.40 | 2.64 | - | - | - | -87.4% | |
|
|
|
|
|
|
|
|
|
|
2023 | 2022 | 2021 | 2020 | 2019 | 2018 | 2017 | Change 2020-2023 | Number of factories | |
Energy/SqM (kWh) | 7.37 | 7.55 | 6.46 | 7.05 | 8.19 | 8.65 | 9.10 | 4.5% | 5 |
CO2/SqM (kg) | 1.61 | 2.34 | 1.89 | 2.72 | 3.21 | 3.16 | 3.39 | -40.7% | |
Water/SqM (L) | 76.4 | 56.9 | 60.9 | 68.3 | 74.7 | 90.20 | 91.80 | 11.7% | |
Waste/SqM (kg) | 0.67 | 0.60 | 0.50 | 0.68 | 0.78 | 0.85 | 1.56 | -1.4% | |
|
|
|
|
|
|
|
|
|
|
2023 | 2022 | 2021 | 2020 | 2019 | 2018 | 2017 | Change 2020-2023 | Number of factories | |
Energy/ton (kWh) | 14,320 | 13,122 | 13,394 | 13,049 | 12,636 | 13,387 | 13,679 | 9.7% | 32 |
CO2/ton (T) | 4.06 | 4.54 | 4.58 | 4.47 | 4.37 | 4.45 | 4.45 | -9.2% | |
Water/ton (m3) | 98.3 | 98.5 | 98.7 | 103 | 106 | 123 | 119 | -4.9% | |
Waste/ton (kg) | 276 | 289 | 121 | 78.9 | 62.1 | 70.6 | 300 | 250.0% | |
|
|
|
|
|
|
|
|
|
|
For tables on E-KPI results, the values for November and December 2023 were estimated by employing the Exponential Smoothing (ETS) algorithm in Microsoft Excel, utilizing data from January to October of 2023. This approach was chosen after comparing it to alternative methods, considering its performance against actual historical data, specifically in terms of deviation from the actual values in percentage terms. The ETS method displayed both higher accuracy and higher precision compared to other methods, such as averaging the last 10/12 months or multiplying the estimated production by the average KPI (per production unit) from the 12 months of data spanning from November 2021 to October 2022.