Products
TARGET DESCRIPTION:
- 90% of PUMA Apparel and Accessories products contain >50% recycled or certified material
- 90% of our Footwear contains at least one component made of recycled or certified material
- Increase use of recycled polyester (Apparel and Accessories) to 75% by 2025
Relates to United Nations Sustainable Development Goal 12
KPIs:
- Percentage of Apparel and Accessories with 50% recycled or certified material
- Percentage of Footwear with at least one recycled or certified component
- Percentage of recycled polyester used in Apparel and Accessories
The PUMA Environmental Profit and Loss Account (EP&L) attributes more than 50% of our environmental impact to material and raw material production. Against this background, we have decided to prioritize the large-scale use of certified or recycled raw materials. In our 10FOR25 strategy, we have set 100% targets for the raw materials of cotton, polyester, leather, and cardboard.
In addition to measuring the use of recycled or certified materials, we also determine the percentage of all products made of such materials. As defined in our PUMA Sustainability Index, or S-Index, S-Index-approved apparel or accessories products contain at least 50% certified or recycled materials by weight. For footwear, we currently measure S-Index conformance by including one or more main components* made from certified or recycled materials.
In 2021 we rolled out an e-learning toolkit on our PUMA S-Index for the PUMA family. The training allows designers, developers, and product managers to understand which materials qualify as more sustainable, how the PUMA S-Index is calculated, and which certifications need to be in place to externally communicate on a product level.
In 2023, 85% of our product by volume met our S-Index definition. We are on track to meet our goals of 90% for 2025.
*Main component in the upper includes the visible upper and its components, linings, sockliner, and strobel as the only non-visible component. They can be made of textile, leather, synthetic (PU) or TPU. It excludes trims such as eyelets, laces, counters, decorations, etc. Main components in the bottom includes outsoles, midsoles, and insoles. They can be made of Rubber, PU, TPU, EVA. It excludes trims and decorations.
Styles 2023 | Volume 2023 | Target 2025 | |
Apparel with at least 50 % certified or recycled material | 77 % | 87 % | 90 % |
Accessories with at least 50 % certified or recycled material | 20 % | 40 %* | 90 % |
Footwear with at least one certified or recycled component | 89 % | 93 % | 90 % |
Total | 75 % | 85 % | 90 % |
|
|
|
|
* Excluding products from stichd; for further details on the reporting scope please refer to the Scope of the Report section.
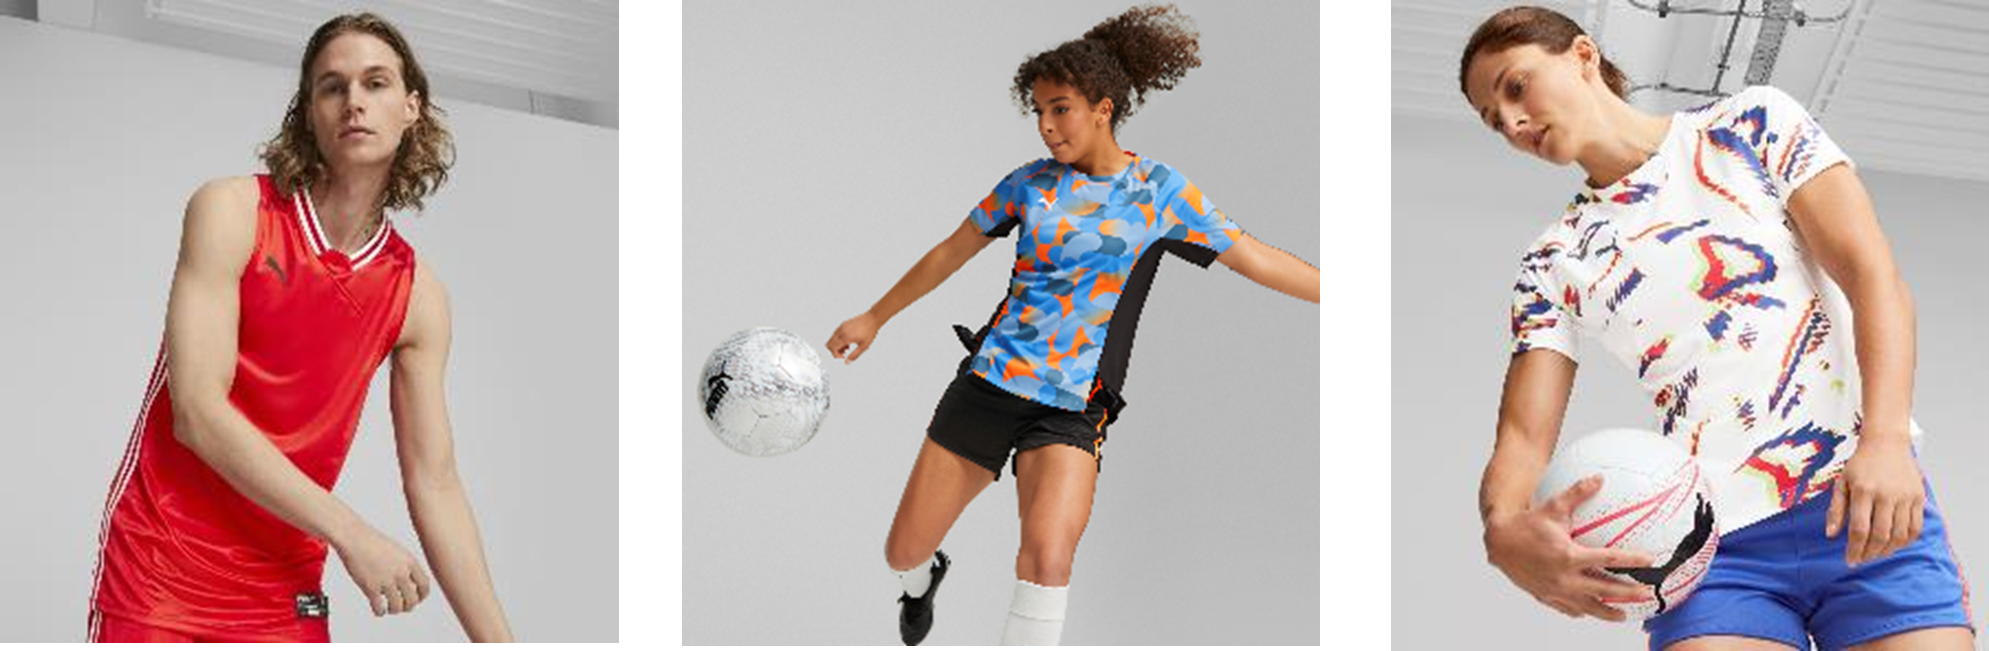
In 2023 we continued to develop and design our collections and individual styles using recycled materials. Highlights include the use of our RE:FIBRE technology in our Teamsport jerseys. The jerseys made with RE:FIBRE are made from at least 95% of recycled textile waste and other used materials made of polyester. We also continued our Downtown collection from Sportstyle and accessories. The different styles in Downtown are made using 20-30% recycled cotton, while the accessories are made from at least 20% recycled content. Another highlight includes the scaling of our Caven shoe, which is made with at least 20% recycled materials in the upper and at least 10% recycled materials in the bottom. Our Downtown collection exceeded 1 million pieces in 2023 and we produced 3 million Caven shoes for the Spring Summer and Autumn Winter collections in 2023 combined.
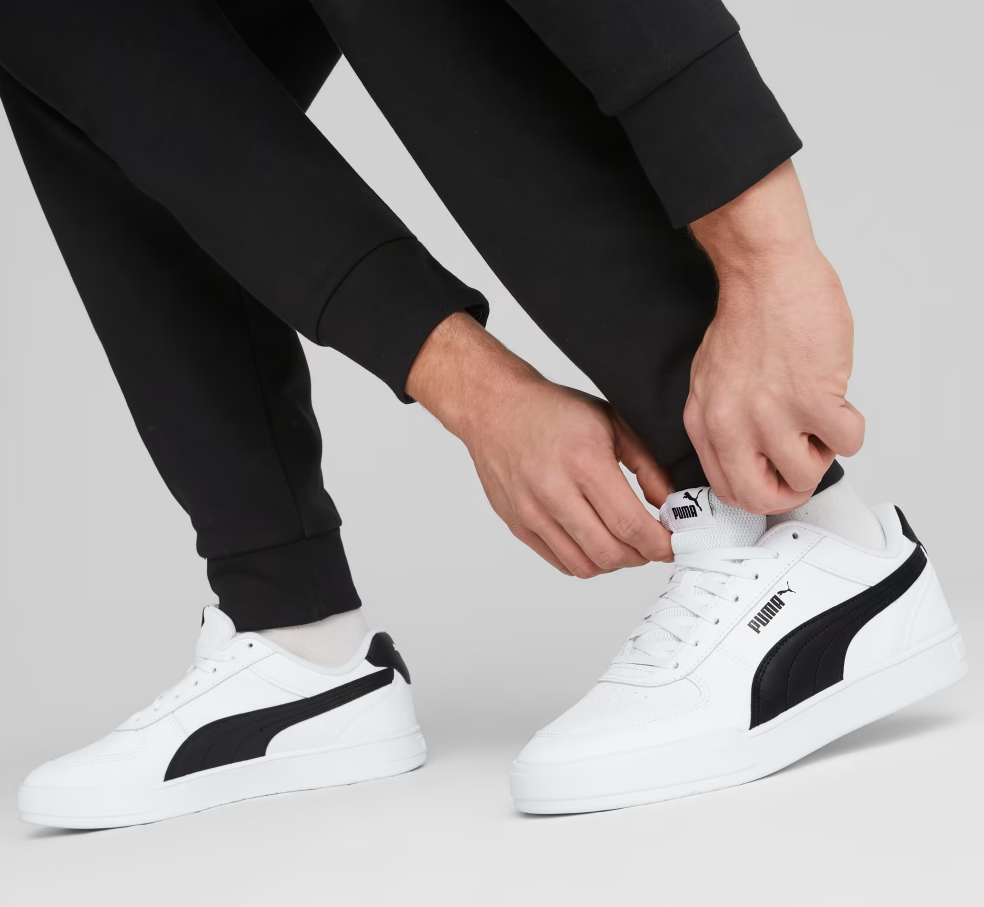
PUMA Caven contains at least 20% recycled content in the upper and 10% recycled content in bottom of the shoe.
PRODUCT LIFE CYCLE ASSESSMENT
We continued the Life Cycle Assessment (LCA) studies of our product portfolios in 2023. The outcomes of an LCA act as a quantifiable measure of our efforts towards embedding sustainability in our products by exploring ways to make our product value chains safer, cleaner and more sustainable. It also encourages innovation in our products and processes so that we can meet increasing social and business expectations regarding sustainability and transparency. Sphera, a leading consulting organisation in the field of LCA, conducted LCA studies to consider all of the elements of the life cycle, from the overall manufacturing including supply of material and energy carriers through to the end of life, when analysing the environmental performance of the products. The LCAs were performed as per ISO 14040 and ISO 14044 requirements. A third-party critical review panel was commissioned to peer review the work and ensure compliance with the mentioned standards.
LCA OF TWO PRODUCTS
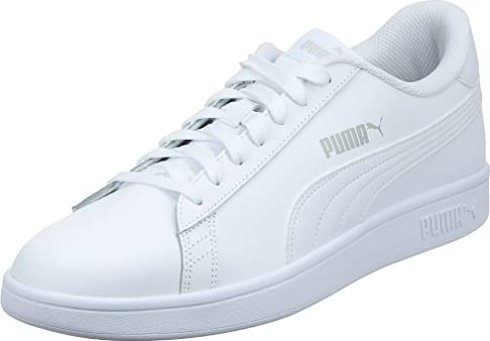
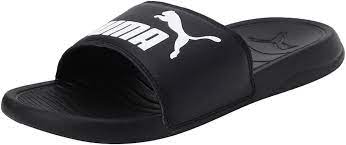
We completed a screening LCA study for two of our top products, the PUMA POPCAT 20 sandals, and the PUMA Smash v2L shoes, to map the environmental footprint of these products across their entire value chains (cradle to grave), excluding the consumer use phase. This helped us to understand the hotspots in the value chain (the maximum impacts in terms of climate, energy and water), and to identify sustainable options in various phases to improve the product’s environmental footprint.
The results of the analysis can be summarised as follows:
↗ G.30 GLOBAL WARMING POTENTIAL
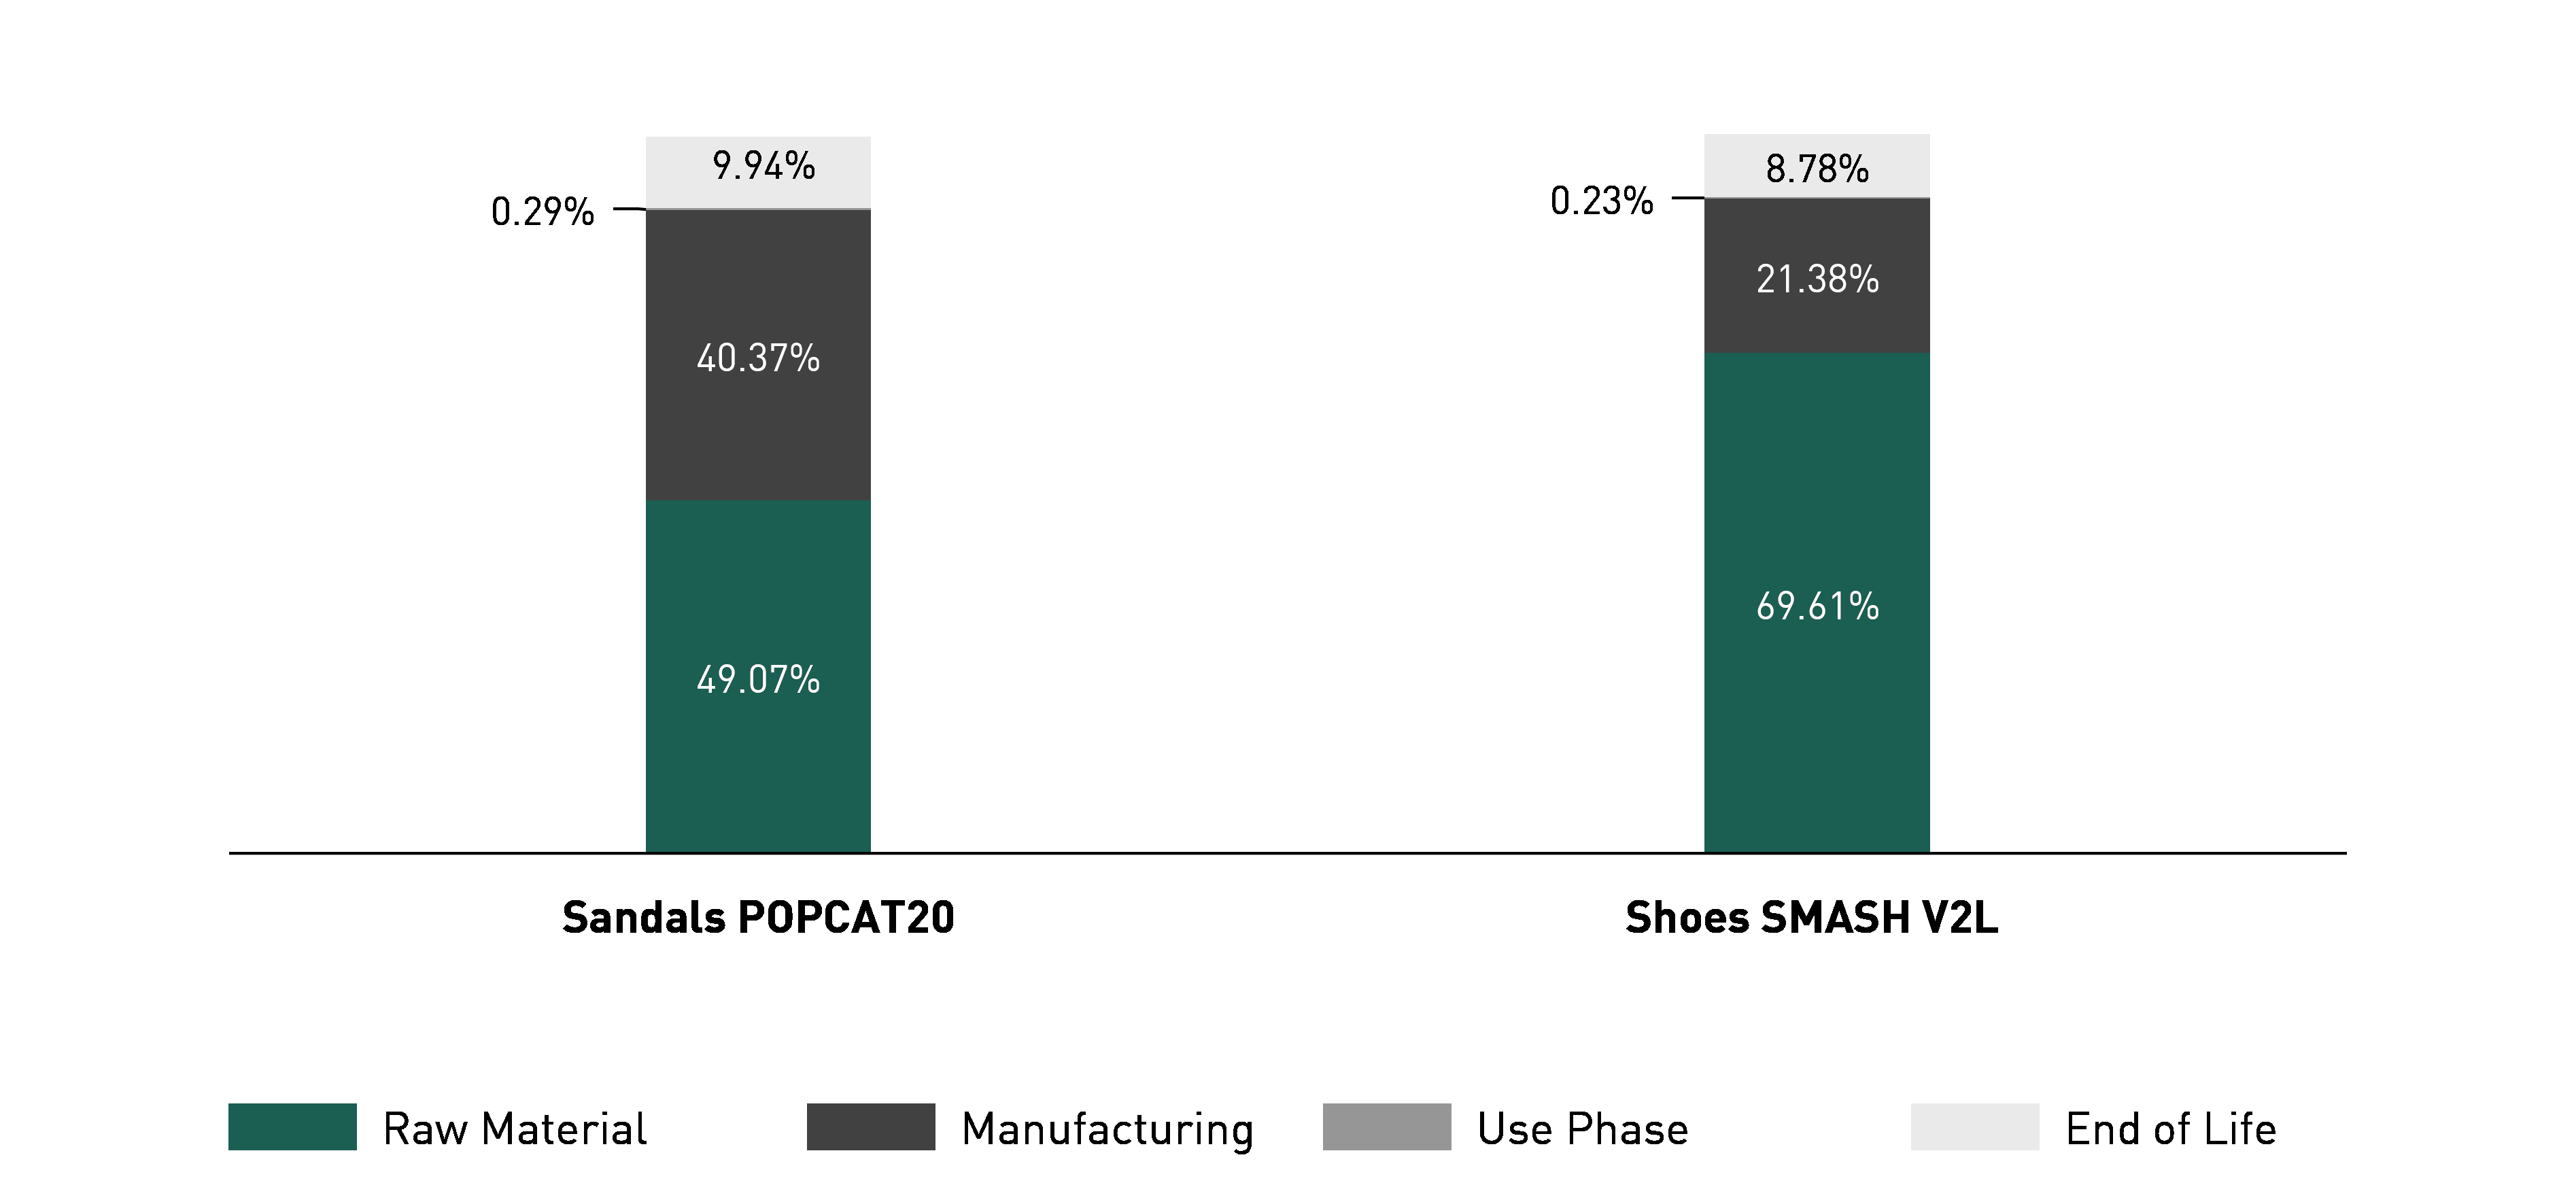
For the POPCAT20 sandals, the global warming potential (GWP) in kg CO2e was mainly influenced by raw materials which include polyester fabric, chemicals etc. (49.07%), manufacturing energy (40.37%) and End of Life (9.94%). Ethylene Vinyl Acetate (EVA) and PU Synthetic are the major contributing materials.
For the SMASHv2L shoes, the global warming potential (GWP in kg CO2e) was mainly influenced by materials which include body material, parts and components (69.61%), manufacturing energy (21.38%), and end-of-life (8.78%). Polyester fabric and rubber are the major contributing materials.
Footwear usually does not require extensive cleaning during its lifetime, and hence the impact of the consumer use phase is negligible. Therefore, the GHG emissions of the use phase from both of the footwear is not considered. However, the end-of-life phase includes reuse, recycling, incineration, and landfilling based on European scenarios, which contributes to GWP impacts of 9.94% for the POPCAT20 sandals and 8.78% for the SMASHv2L shoes.
↗ G.31 PRODUCT ENVIRONMENTAL FOOTPRINT1-2

1Primary energy is the energy that is harvested directly from natural resources: coal, oil, natural gas and uranium.
2Blue water is water that has been sourced from surface or groundwater resources and is either evaporated or incorporated into a product.
For the POPCAT20 sandals, the total global warming potential is 1.61 kg CO2e. The total primary energy demand is 32.36 MJ with major contributions from ethylene vinyl acetate (EVA) (60.60%) and PU Synthetic (11.48%). The total blue water consumption is 31.02 kg with major contributions from the raw material PU Synthetic blend (51.85%) which contains 52% recycled polyester and 48% polyurethane. The remaining contribution comes from other materials, chemicals, electricity and fuel consumption.
For the SMASHv2L shoes, the total global warming potential is 4.61 kg CO2e. The total primary energy demand is 90.38 MJ with major contributions from the polyester fabric (30.04%) and rubber (22.04%). The total blue water consumption is 41.33 kg with major contributions from PU-coated leather (33.41%).
POPCAT 20 sandals have a significantly smaller (65%) carbon footprint than SMASH v2L shoes. One reason for this is the lower net weight of POPCAT 20, which is 60% lower. Looking at the carbon footprint of materials, in the case of POPCAT 20, 64.5% of climate impact comes from the Ethylene Vinyl Acetate (EVA) while for Smash V2L, the majority of the impact comes from polyester and rubber, which accounts for 65.4% of the carbon footprint of the raw material of the product. This indicates that low-carbon material such as EVA has also contributed to the lower carbon footprint of POPCAT 20. Looking at energy consumption during production, POPCAT 20 consumed 52% less electricity than SMASH v2L. This can be attributed to the lower net weight and the simplicity of the POPCAT 20 product design.
Though the SMASH v2L has a larger carbon footprint than the POPCAT 20, it is much smaller (4.61 kg CO2e) when compared to previously conducted LCAs of footwear products in 2021 i.e. the Future Rider Play on
(9.49 kg CO2e) and Velocity Nitro (7.6 kg CO2e). Both the Future Rider Play on and Velocity Nitro have a lower net weight of 0.78 kg and 0.72 kg as compared to the SMASH v2L which has a net weight of 0.955 kg/pair. The SMASH v2L is made of recycled materials such as recycled polyester, recycled PU, and recycled rubber along with recycled packaging materials and the quantity of leather used is much lower, which explains the lower carbon footprint when compared to the Rider Play on and Velocity Nitro.
The key takeaways from the LCA study are, to make future footwear products lighter, increase the usage of low-impact materials such as recycled polyester or recycled PU and reduce the use of high-impact materials such as virgin PU and virgin polyester. The supply chain for footwear products is complex and involves multiple stages such as raw material extraction, processing, finishing, assembly, distribution and end of life. The LCA study is used to understand the value chain environmental impacts of our products.
PUMA intends to use the outcomes of the study to raise internal awareness and improve the product’s environmental footprint by increasing the use of more sustainable materials (recycled or biosynthetic), improving resource efficiency, optimizing energy use, promoting renewable energy in the value chain, and enhancing the circularity of our products.
COMPARATIVE LCA VIRGIN POLYESTER VS. PET RECYCLED POLYESTER VS. RE:FIBRE POLYESTER products
In 2023, PUMA engaged Sphera, Inc. to conduct a comparative Life Cycle Assessment (LCA) of three types of sports jerseys made from virgin polyester, PET recycled polyester and RE:FIBRE, in our Turkey supply chain. The RE:FIBRE process uses mainly polyester material from factory offcuts, faulty goods and used clothes. PET recycled polyester comes from PET plastic bottles.
The LCAs were performed using the “cradle to grave” approach. The objective was to quantify the environmental impacts associated with the production of these three types of jerseys using the LCA approach. The products studied were:
The scope of this study includes raw material sourcing and extraction, transportation of raw materials to the manufacturing location, manufacturing of the jersey products, product distribution, product use phase and end of life (EoL) of product and packaging.
The LCA study indicates that per kg, the PET recycled polyester jersey has the smallest carbon footprint (13.19% lower as compared to virgin polyester jersey) among the three products compared in the study. Whereas, per kg, the RE:FIBRE polyester jersey has a 7.31% lower Global Warming Potential (GWP) impact when compared to the virgin polyester jersey. The RE:FIBRE polyester jersey has 57% chemically recycled fibre which has a higher GWP impact as compared to mechanically recycled fibre but a lower one than virgin recycled fibre.
The total primary energy demand also exhibits a similar trend, due to same factor as the carbon footprint. The PET recycled polyester jersey and RE:FIBRE Polyester Jersey are 16.15% and 12.13% lower respectively per kg than the virgin polyester jersey.
The LCA study also indicates that, the water consumption per kg of PET recycled polyester jersey and RE:FIBRE polyester jersey is 1.10% and 2.82% higher than per kg value of the virgin polyester jersey.
Although textile-to-textile technology currently has a larger environmental footprint than mechanical recycling, through the RE:FIBRE programme, PUMA is keen to address the challenge of textile waste via a long-term solution for recycling. The technology also looks to diversify the fashion industry’s main source of recycled polyester in garments to make it less reliant on clear plastic bottles. We also believe that this technology has room to become more energy efficient in future.
Managing waste has become a necessity, which is why PUMA is ramping up its investment into resource-efficient manufacturing processes in a move to reduce textile waste. Textile waste build-up in landfills is an environmental risk. Rethinking the way we produce and moving towards a more circular business model is one of the main priorities of our Sustainability Strategy.
To help make the technical process of RE:FIBRE more digestible for the everyday consumer who wants to know more, PUMA has created a RE:FIBRE process explainer video, which can be accessed here.
The four-step process of RE:FIBRE:
- Collect and Sort: collecting and sorting textile waste and other previously wasteful materials.
- Shred and Mix: shredding and mixing the collected materials
- Dissolve, Filter and Polymerize: Dissolving the shredded polyester and removing dyes through a chemical recycling process.
- Melt, Spin, Knit and Sew: The melting makes the newly produced polymers ready to be spun and sewn into shape to create good as new RE:FIBRE fabric which can be recycled again and again.
↗ G.32 ENVIRONMENTAL FOOTPRINT OF POLYESTER jerseys1-2

1Primary energy is the energy that is harvested directly from natural resources: coal, oil, natural gas and uranium.
2Blue water is water that has been sourced from surface or groundwater resources and is either evaporated or incorporated into a product.
COMPARATIVE LCA of 3 types of Cotton Fabric
PUMA engaged Sphera to conduct a comparative Life Cycle Assessment (LCA) of one kilogramm of 100% virgin piece dyed cotton fabric, 75/25 virgin/undyed recycled piece dyed cotton fabric and 75/25 virgin/coloured recycled piece dyed cotton fabric.
Piece dyed fabric is fabric made of grey yarns which are dyed, and is different to yarn dyed fabric: a fabric that is knitted using dyed yarn.
LCAs are performed using the “cradle to gate” approach. Since this is the “cradle to gate” approach, consumer use phase and fabric end-of-life impacts for the cotton fibre products were not considered in this LCA study.
The main objective of the study is to quantify the environmental impacts associated with the production of these fabrics across various life cycle stages of the manufacturing process, including the supply of raw materials and energy carriers. The primary data considered for the study was collected from three PUMA suppliers stretched across two regions, Bangladesh (two factories) and Turkey (one factory). The data collected includes data for all the production processes such as collection and pre-processing, yarn spinning, knitting and inspection, pre-treatment, dyeing, compacting and drying.
The LCA study indicates that for one kg of 75/25 virgin/undyed recycled piece dyed cotton fabric, the carbon footprint is 5.83% smaller compared to the 100% virgin piece dyed cotton fabric. This change was mainly influenced by the inclusion of 25% undyed recycled cotton material. For 1 kg of 75/25 virgin/coloured recycled piece dyed cotton fabric, the carbon footprint was smaller by 13% when compared to the 100% virgin piece dyed cotton fabric. This change was mainly influenced by the inclusion of 25% coloured recycled piece dyed cotton fabric. When comparing these three fabrics, the environmental impacts of 75/25 virgin/coloured recycled piece dyed cotton fabric were found to be the lowest. This is due to the usage of 25% recycled yarn which is recovered from a coloured fabric and hence requires fewer chemicals and less energy during the dyeing process.
↗ G.33 ENVIRONMENTAL FOOTPRINT OF COTTON FABRICS

Additionally, it was found that the most significant carbon footprint impact is related to the conventional dyeing of fabric followed by the impacts of cotton cultivation and yarn spinning. Primary energy demand is largely driven by the cultivation of cotton, followed by conventional dyeing of fabric. Water consumption is largely driven by cotton cultivation followed by conventional dyeing, compacting and drying processes.
In the study, we also evaluated the environmental impacts of different types of dyeing technologies such as conventional and Pad-Steam dyeing processes for the three types of fabrics. The Pad-Steam process is a textile finishing technique used to apply chemicals or dyes to fabric. It is a combination of two steps: padding and steaming. This process is employed to achieve uniform coloration, improved fabric properties, and enhanced performance characteristics. This study was conducted at a factory located in Turkey that uses both technologies. Conventional dyeing for knitted products is typically a batch process in which the fabric is loaded along with water, chemical and dyestuffs and processed for a fixed number of hours based on the type of fabric. Whereas, Pad-Steam dyeing is a continuous dyeing process, in which the fabric is dyed by immersing the fabric in the dye solution for a few seconds, immediately pressed through a roller and then steamed. Pad-Steam dyeing is more resource-efficient as compared to conventional dyeing. This was further corroborated by our LCA study. Pad-Steam dyeing was found to have a smaller environmental footprint than conventional dyeing. It was observed that the Pad-Steam dyeing process has 81.9% less energy and 80.5% less water consumption as compared to the conventional dyeing process.
It was found that Pad-Steam dyeing for 100% virgin piece dyed cotton fabric has a 34.8% smaller carbon footprint as compared to conventional dyeing. The corresponding figure for 75/25 virgin/undyed recycled piece dyed cotton fabric was 36.9% and 25.02% for 75/25 virgin/coloured recycled piece dyed cotton fabric. Similar trends were also observed for primary energy demand and water consumption.
The LCA study clearly indicates that the inclusion of recycled cotton fabrics has a smaller environmental footprint and hence is to be promoted for future product development. However, there are currently technological limitations surrounding increasing recycled cotton to more than 25% in a cotton fabric mix. This calls for a focus on future innovation in this area. Furthermore, our suppliers could adopt better dyeing technologies such as the Pad-Steam dyeing process which has a smaller environmental footprint.
MATERIAL ORIGIN
Mapping and assessing risk and impact practices in the lower tiers of the supply chain helps us to identify opportunities for improvement.
COTTON
In 2023, we sourced approximately 34,000 tons of cotton. To reach our 100% targets for certified or recycled cotton, we require our suppliers to only source cotton from farms that are licensed or certified as having good farming and human rights standards, or recycled cotton. 96% of the cotton used in PUMA products comes from the USA, Brazil, Australia, India, Bangladesh, Vietnam, Indonesia and Turkey.
LEATHER
In 2023, we sourced approximately 3,500 tons of bovine leather. We are working on improving the traceability of the leather we use by recording the traceability score of our leather manufacturers certified by the Leather Working Group. The leather used in PUMA footwear mainly comes from the USA (61%), Argentina (27%), Australia (6%) and Brazil (5%). We also monitor our LWG (Leather Working Group) medal-rated tanneries' traceability performance. Most suede tanneries work with agents and intermediaries besides direct tanneries to guarantee a stable sourcing supply. Suede is a byproduct of the full-grain leather business. This creates a challenge to full traceability. This explains why our suede leather LWG tanneries have a worse traceability performance than full-grain LWG tanneries. We aim to increase all of our LWG medal-rated tanneries’ traceability performance over time.
MATERIAL CONSUMPTION DATA
↗ G.34 CERTIFIED OR RECYCLED MATERIALS DEVELOPMENT1-2
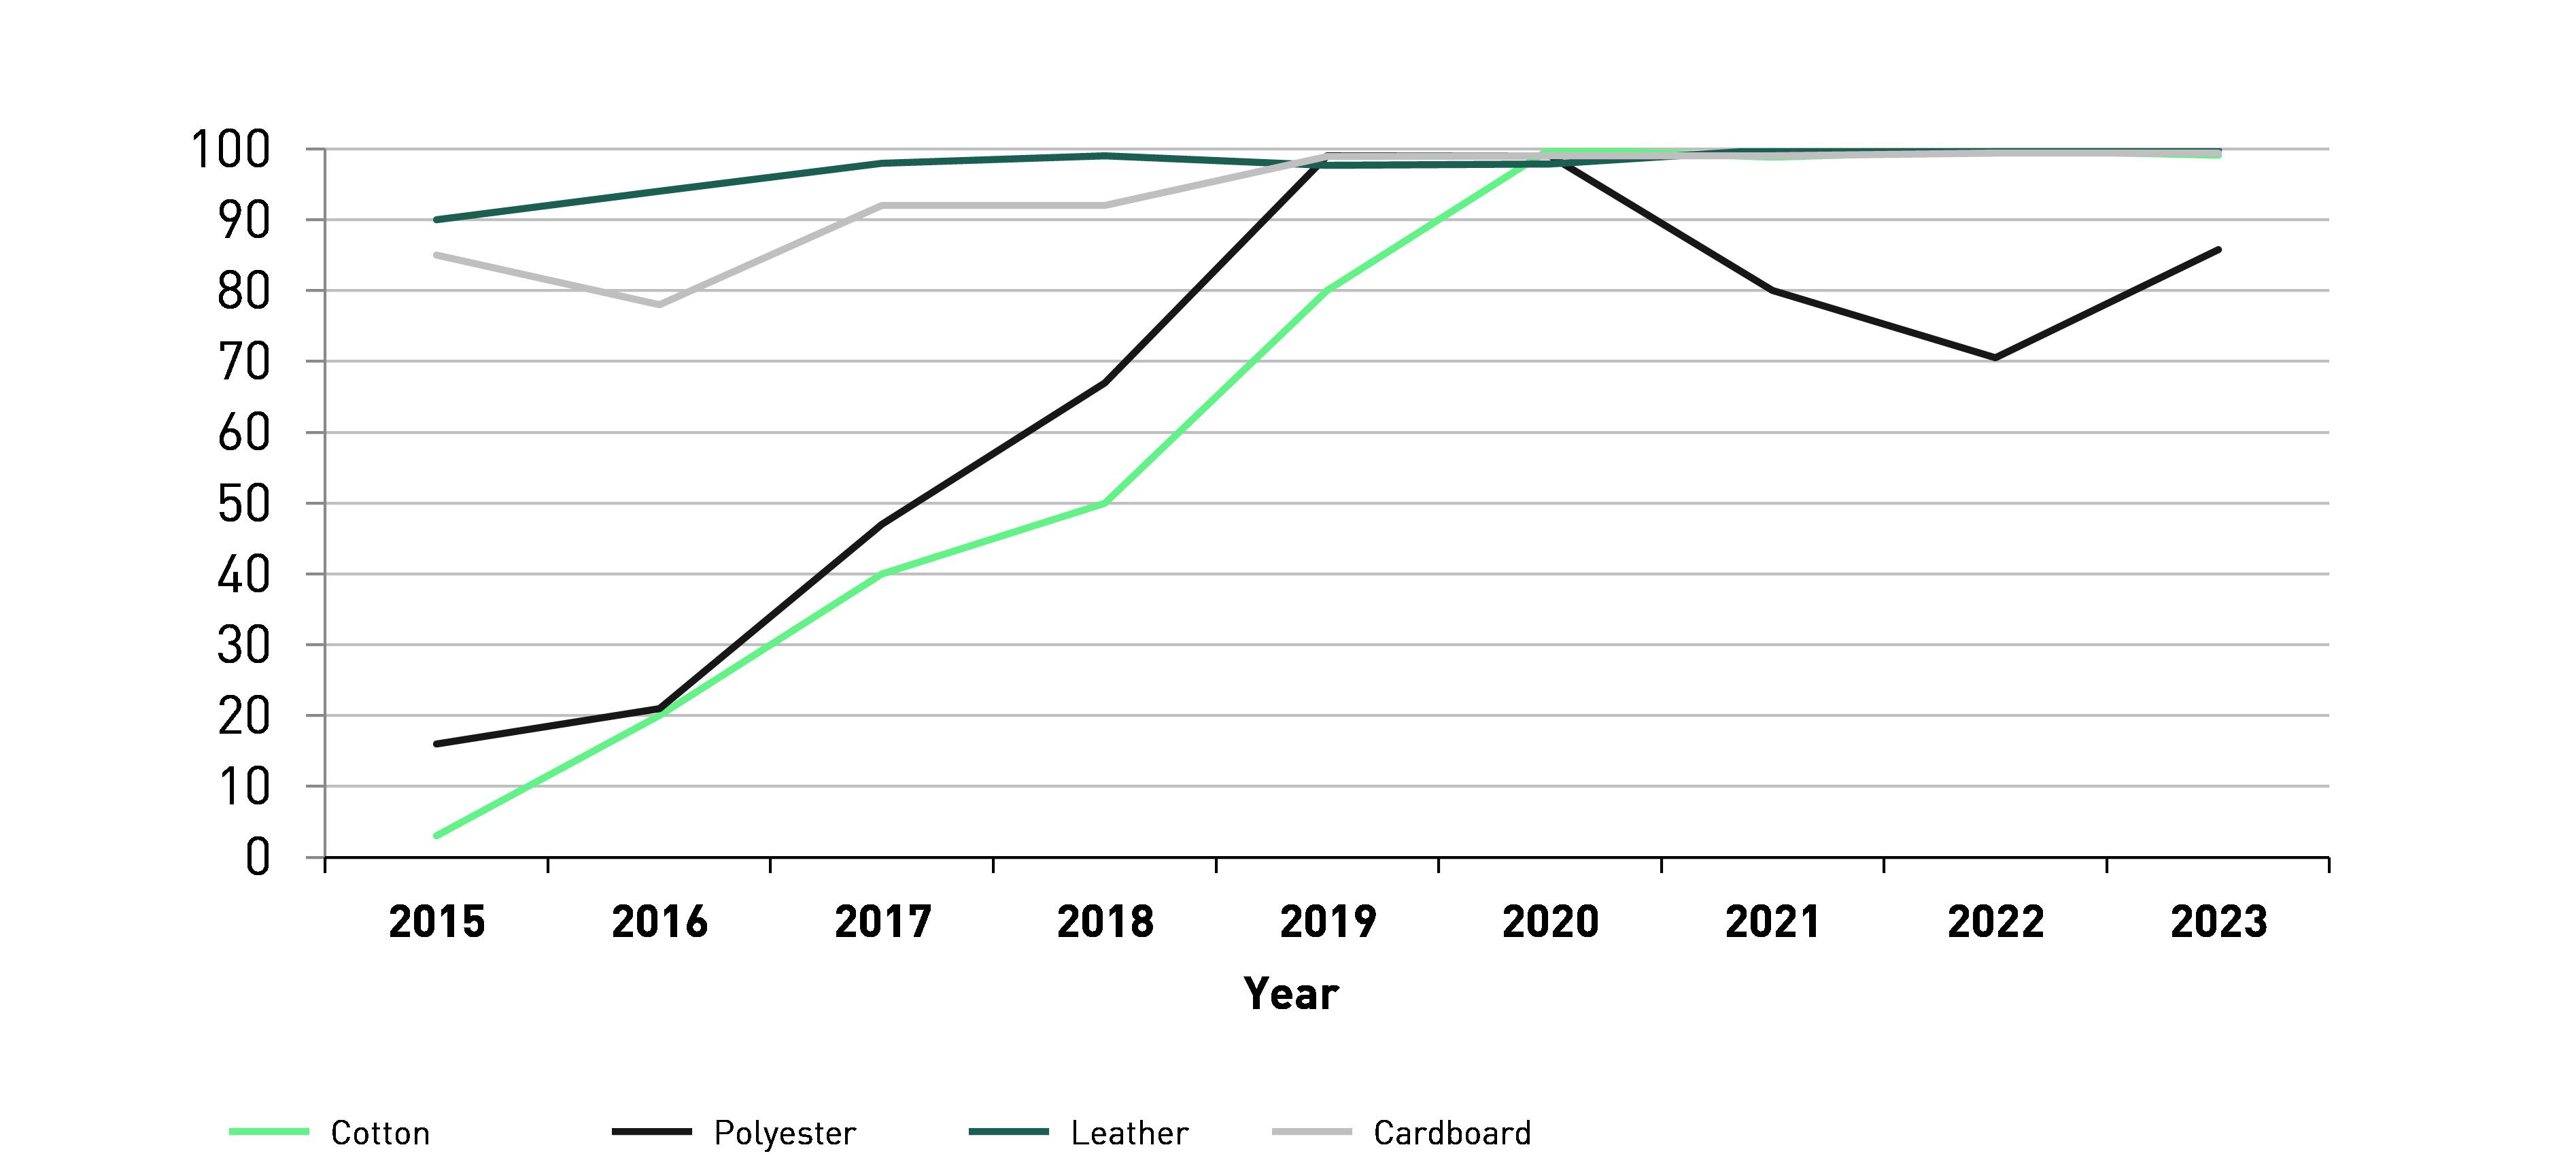
1Cotton and polyester including apparel and accessories material (including trims)
2Proliferation for 2023 based on actual data in January - September 2023 and previous data October - December 2022
As in previous years, a significant percentage of our materials can be attributed to cotton either from the Better Cotton Initiative, recycled or organic cotton, to polyester that is either bluesign® or OEKO-TEX®-certified, recycled or bio-based polyester, and to leather sourced from Leather Working Group (LWG)-certified tanneries or recycled leather. In addition, we only use down feathers certified by the Responsible Down Standard and 84% of our man-made cellulosic (MMCF) is made by green shirt-rated MMCF suppliers with a proven track record on sustainability based on the Hot Button report from the NGO Canopy. Therefore, more than 87% of our apparel, 40% of our accessories and 93% of our footwear products are already classified in line with the definition in our PUMA Sustainability Index.
Coverage and calculations are more complex for footwear because all of our shoes are made from several components. The main materials we use are polyester, polyurethane, rubber, leather and nylon. In line with our earlier targets, we have achieved 99.7% coverage of leather sourced from LWG-certified tanneries.
In 2023, 99.2% of the cotton used came from certified or recycled sources, as did 85% of our polyester.
We hardly used wool in 2023 (6,566 kg). Nevertheless, we see an increased number of factories certified in line with the Responsible Wool Standard (RWS). We organised a RWS training for our in-scope suppliers in June 2023, and the positive results were shown by the six RWS-certified factories in our supply chain. We aim to reach 100% certified wool in 2025.
Apparel | Accessories | Footwear | Total | |
Better Cotton | 90.6 % | 23.2 % | 8.0 % | 90.3 % |
Recycled | 8.6 % | 16.7 % | 1.6 % | 8.6 % |
Organic | 0.3 % | 0.3 % | 0.3 % | |
Conventional | 0.6 % | 59.7 % | 90.5 % | 0.9 % |
Polyester | Apparel | Accessories | Footwear | Total |
Recycled | 68.4 % | 29.3 % | 56.5 % | 61.8 % |
Oekotex® / bluesign® | 30.3 % | 54.5 % | 8.1 % | 23.3 % |
Sorona® | 0.1 % | 0.2 % | 0.1 % | |
Conventional | 1.2 % | 16.2 % | 35.2 % | 14.8 % |
Manmade cellulosics | Apparel | Accessories | Footwear | Total |
Green Shirt-rated fiber producers** | 82.4 % | 72.7 % | ||
Ecovero® | 12.7 % | 0.7 % | 11.3 % | |
Conventional | 4.9 % | 100.0 % | 99.3 % | 16.0 % |
Polyamide (nylon) | Apparel | Accessories | Footwear | Total |
Recycled | 26.4 % | 60.2 % | 2.0 % | 19.3 % |
Oekotex® / bluesign® | 70.8 % | 38.2 % | 13.9 % | 46.9 % |
Conventional | 2.8 % | 1.6 % | 84.2 % | 33.8 % |
Leather | Apparel | Accessories | Footwear | Total |
LWG medal-rated tannery | 99.96 % | 99.7 % | ||
Recycled | 0.04 % | 0.04 % | ||
Conventional | 100.0 % | 0.22 % | ||
Rubber | Apparel | Accessories | Footwear | Total |
Synthetic | 34.7 % | 52.6 % | 93.9 % | 93.0 % |
Natural | 65.3 % | 32.5 % | 1.2 % | 1.9 % |
Recycled | 15.0 % | 4.9 % | 5.1 % | |
PU | Apparel | Accessories | Footwear | Total |
Recycled | 2.4 % | 1.5 % | 2.4 % | 2.4 % |
Oekotex® / bluesign® | 93.4 % | 0.8 % | ||
Water-based | 0.02 % | 1.1 % | 1.0 % | |
Bio-based | 0.4 % | 0.4 % | ||
Conventional | 4.3 % | 98.48 % | 96.1 % | 95.4 % |
Down | Apparel | Accessories | Footwear | Total |
RDS certified | 100 % | 100 % | ||
|
|
|
|
|
* Figures include trims and exclude licensee production as well as production from stichd. For further details on the reporting scope, please refer to the Scope of the Report section.
** Green Shirt-rated fiber producers, as set by the annual Canopy Hot Button report, encourage existing fiber suppliers to commit to CanopyStyle and a Canopy Audit.
2023 | 2025 target | |
Apparel | ||
Certified or recycled cotton | 99.4 % | 100 % |
Certified or recycled polyester | 98.8 % | 100 % |
Certified or recycled MMCF | 95.1 % | 100 % |
Certified or recycled PU | 95.7 % | NA |
Accessories | ||
Certified or recycled cotton | 40.3 % | 100 % |
Certified or recycled polyester | 83.8 % | 100 % |
Certified or recycled MMCF | 0.0 % | 100 % |
Certified or recycled leather | 0.0 % | 100 % |
Certified or recycled PU | 1.5 % | NA |
Footwear | ||
Certified or recycled cotton | 9.5 % | 100 % |
Certified or recycled polyester | 64.8 % | 100 % |
Certified or recycled MMCF | 0.7 % | 100 % |
Certified or recycled leather | 100 % | 100 % |
Certified or recycled PU | 3.9 % | NA |
L&P paper/cardboard products** | ||
Recycled and/or FSC-certified | 99.4 % | 100 % |
|
|
|
* Figures include trims and exclude licensee production as well as production from stichd. For further details on the reporting scope, please refer to the Scope of the Report section.
** Including outer cardboard boxes, which were excluded in previous years.
In 2023, the total number of GRS/RCS certified factories has increased to 159 from 145 in 2022. This indicates a higher uptake of recycled material due to the launch of more sustainable products in our product mix.
In 2023, we saw an increased number of factories certified by the Responsible Wool Standard.
GRS/RCS | GOTS | OCS | RDS | RWS | LWG | |
Apparel & Accessories Tier 1 and Tier 2 | 128 | 30 | 23 | 6 | 6 | NA |
Footwear Tier 1 and Tier 2 | 31 | 0 | 1 | NA | 1 | NA |
Leather Tanneries | 32 Gold | |||||
4 Silver | ||||||
|
|
|
|
|
|
|
1GRS: Global Recycling Standard, RCS: Recycled Claim Standard, OCS: Organic Content Standard; GOTS: Global Organic Content Standard; RDS: Responsible Down Standard, RWS: Responsible Wool Standard, LWG: Leather Working Group.