Net assets and financial position
31 Dec. 2023 | 31 Dec. 2022 | ||||
€ million | % | € million | % | +/-% | |
Cash and cash equivalents | 552.9 | 8.3% | 463.1 | 6.8% | 19.4% |
Inventories * | 1,804.4 | 27.2% | 2,245.1 | 33.1% | -19.6% |
Trade receivables * | 1,118.4 | 16.8% | 1,064.9 | 15.7% | 5.0% |
Other current assets * | 385.6 | 5.8% | 304.1 | 4.5% | 26.8% |
Other current assets | 69.8 | 1.1% | 123.2 | 1.8% | -43.4% |
Current assets | 3,931.1 | 59.2% | 4,200.4 | 62.0% | -6.4% |
Deferred tax assets | 296.1 | 4.5% | 295.0 | 4.4% | 0.3% |
Right-of-use assets | 1,087.7 | 16.4% | 1,111.3 | 16.4% | -2.1% |
Other non-current assets | 1,325.6 | 20.0% | 1,166.0 | 17.2% | 13.7% |
Non-current assets | 2,709.3 | 40.8% | 2,572.3 | 38.0% | 5.3% |
Total assets | 6,640.4 | 100.0% | 6,772.7 | 100.0% | -2.0% |
Current borrowings | 145.9 | 2.2% | 75.9 | 1.1% | 92.3% |
Trade payables * | 1,499.8 | 22.6% | 1,734.9 | 25.6% | -13.6% |
Other current liabilities * | 631.3 | 9.5% | 792.3 | 11.7% | -20.3% |
Current lease liabilities | 212.4 | 3.2% | 200.2 | 3.0% | 6.1% |
Other current liabilities | 47.7 | 0.7% | 39.7 | 0.6% | 20.1% |
Current liabilities | 2,537.2 | 38.2% | 2,843.0 | 42.0% | -10.8% |
Non-current borrowings | 426.1 | 6.4% | 251.5 | 3.7% | 69.4% |
Deferred tax liabilities | 12.4 | 0.2% | 42.0 | 0.6% | -70.5% |
Pension provisions | 22.5 | 0.3% | 22.4 | 0.3% | 0.7% |
Non-current lease liabilities | 1,020.0 | 15.4% | 1,030.3 | 15.2% | -1.0% |
Other non-current liabilities | 40.0 | 0.6% | 44.7 | 0.7% | -10.5% |
Non-current liabilities | 1,520.9 | 22.9% | 1,390.9 | 20.5% | 9.4% |
Equity | 2,582.3 | 38.9% | 2,538.8 | 37.5% | 1.7% |
Total liabilities and equity | 6,640.4 | 100.0% | 6,772.7 | 100.0% | -2.0% |
Working Capital | 1,177.3 | 1,086.8 | 8.3% | ||
- in % of sales | 13.7% | 12.8% | |||
|
|
|
|
|
|
* included in working capital
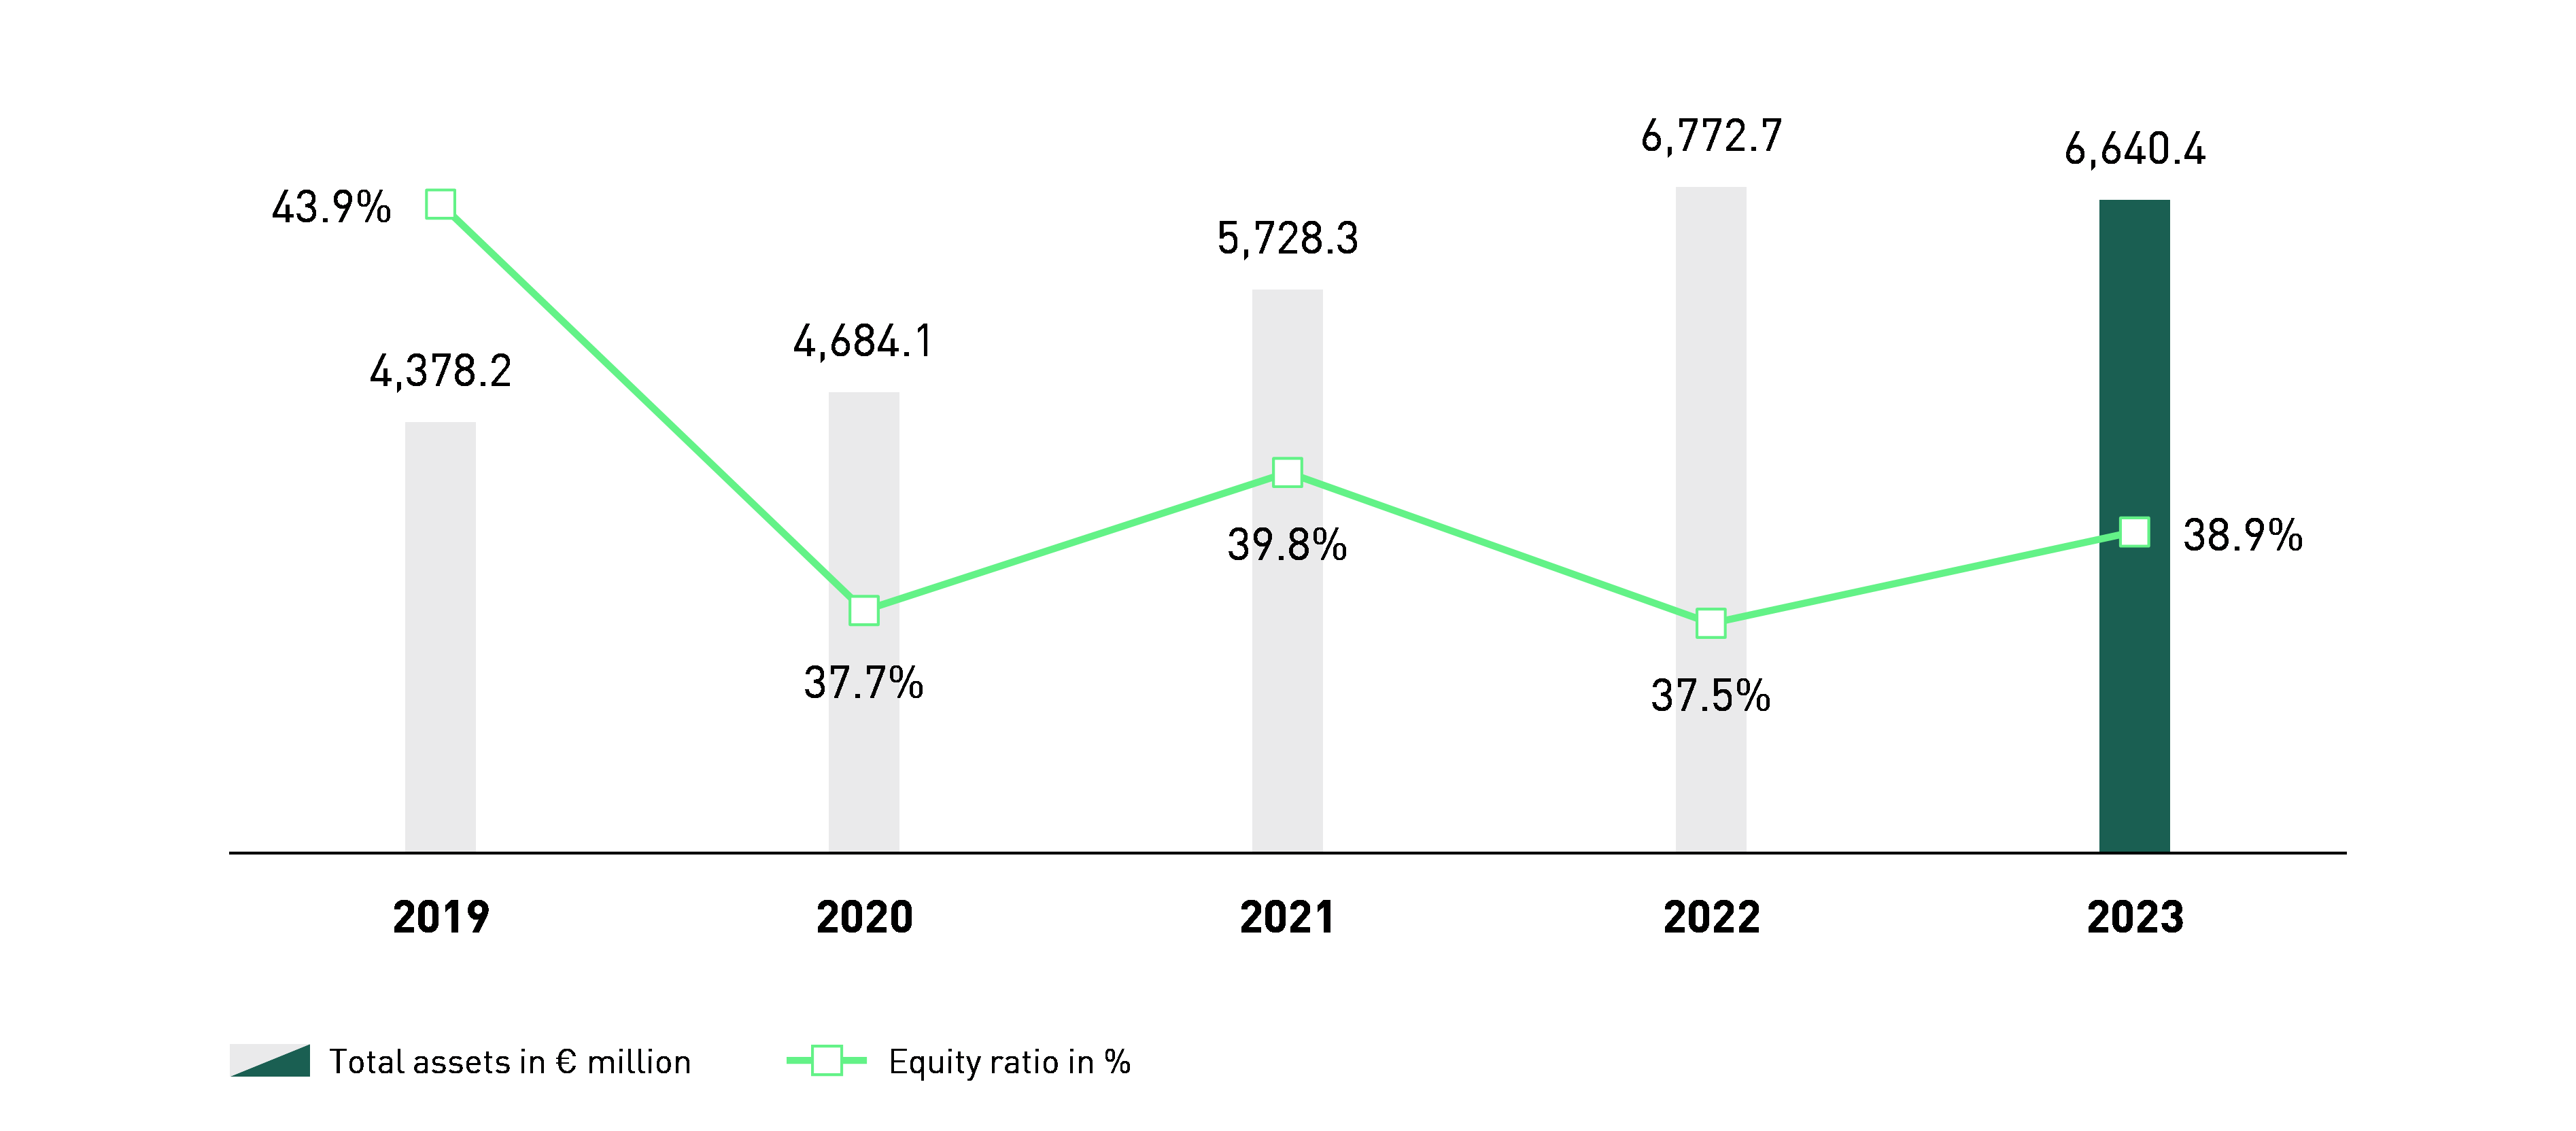
Equity ratio
PUMA has a very solid capital base. As of the balance sheet date, the equity of the PUMA Group increased by 1.7%, from € 2,538.8 million in the previous year to € 2,582.3 million as of 31 December 2023. Although the positive consolidated income contributed to the increase in Group equity, there was a negative impact of € - 85.9 million from the other comprehensive income that is directly recorded in equity, mainly due to negative currency conversion differences. The balance sheet total decreased slightly by 2.0% as at the balance sheet date, to € 6,640.4 million (from € 6,772.7 million in the previous year). Overall, this resulted in an increase in the equity ratio of 1.4 percentage points from 37.5% in the previous year to 38.9% as at 31 December 2023.
↗ G.15 BALANCE SHEET TOTAL/EQUITY RATIO
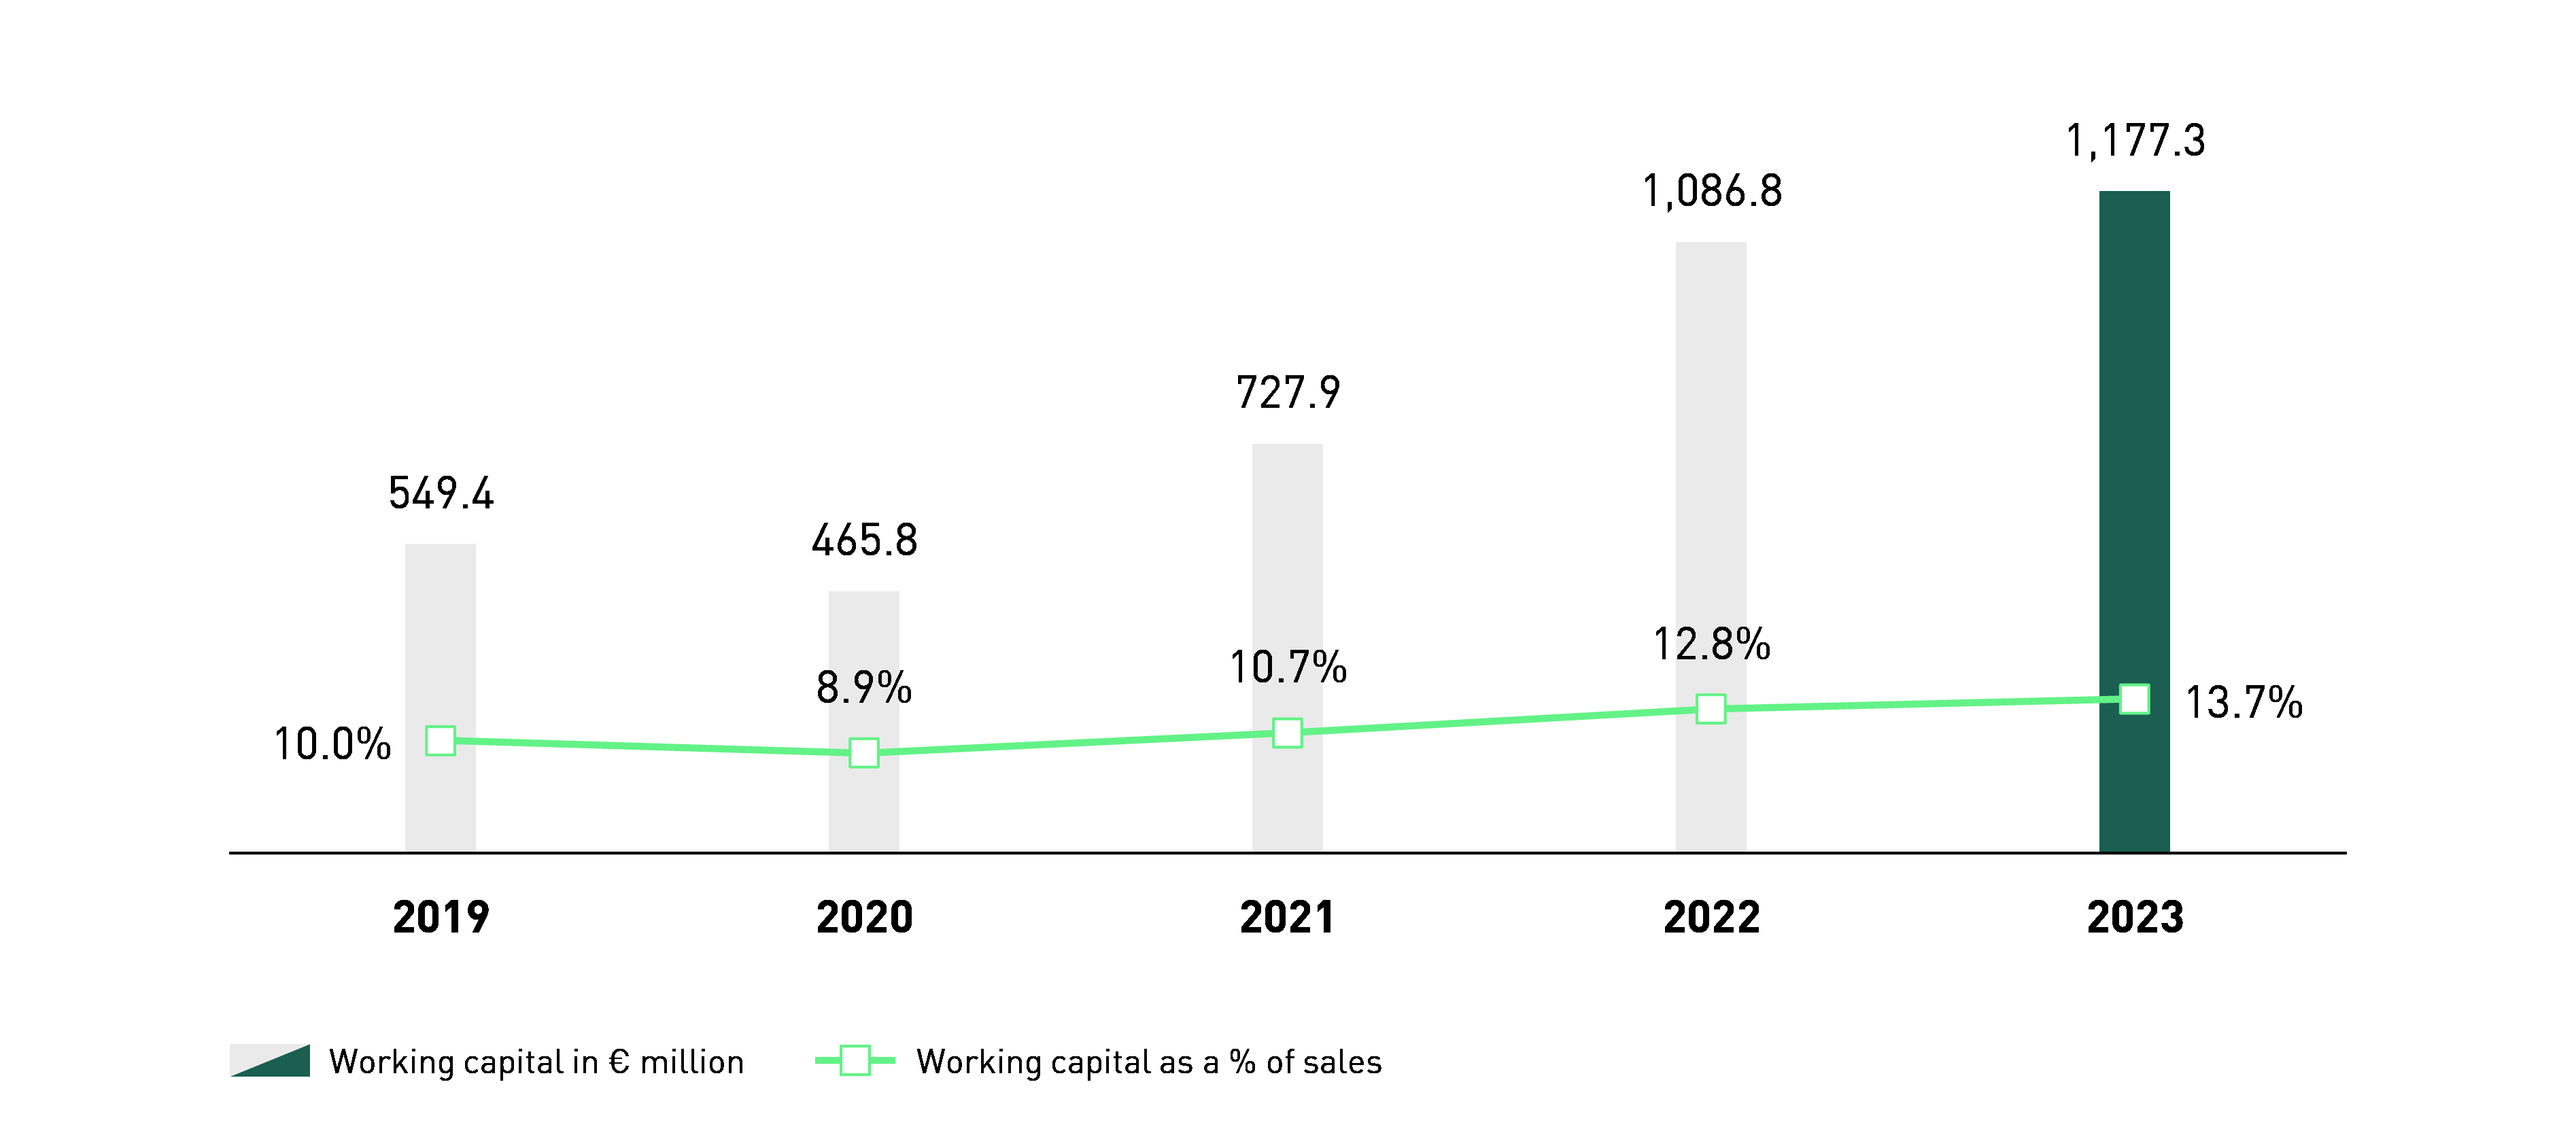
Working capital
As of the balance sheet date, working capital increased by 8.3% from € 1,086.8 million in the previous year to € 1,177.3 million as of 31 December 2023. In relation to sales in the respective financial year, this corresponds to an increase in the working capital ratio from 12.8% in the previous year to 13.7% at the end of 2023. This development was mainly attributable to the decline of trade payables due to the adjusted sourcing volumes in 2023 and the decrease in other current liabilities and provisions included in working capital. In addition, higher trade receivables and higher other current assets attributable to working capital contributed to the increase. In contrast, the reduction in inventories had the opposite effect.
On the assets side, inventories fell by 19.6% as at the balance sheet date, to € 1,804.4 million (from € 2,245.1 million). This development shows that our previous measures to reduce inventories to an appropriate level were successful. Trade receivables increased due to longer customary payment terms by 5.0% to € 1,118.4 million (from € 1,064.9 million) as at the balance sheet date. Other current assets, which are attributable to working capital rose by 26.8% to € 385.6 million (from € 304.1 million), primarily due to higher advance payments and tax refund claims.
On the liabilities side, trade payables decreased by 13.6% to € 1,499.8 million (from € 1,734.9 million) due to the adjusted sourcing volumes. The other current liabilities and provisions, which are contained in working capital and include, among other things, customer bonus and warranty provisions, decreased by 20.3% to € 631.3 million (from € 792.3 million).
↗ G.16 WORKING CAPITAL
Other assets and other liabilities
Other current assets outside of working capital include, in particular, the positive market value of derivative financial instruments and current receivables from leases. Overall, other current assets outside of working capital decreased to € 69.8 million, compared to € 123.3 million in the previous year.
Right-of-use assets fell slightly by 2.1% to € 1,087.7 million (from € 1,111.3 million in the previous year). The decline was due to the ongoing depreciation of right-of-use assets and the effects of subleasing. In contrast, the additions to right-of-use assets in 2023 were mainly related to newly opened retail stores and extensions or contract amendments to existing retail stores as well as the opening of new warehouses or the expansion of existing warehouses. The right-of-use assets referred to own retail stores totalling € 464.2 million (previous year: € 430.9 million), warehouses and offices totalling € 557.7 million (previous year: € 613.1 million) and other lease items, mainly technical equipment and machines and motor vehicles, totalling € 65.7 million as of 31 December 2023 (previous year: € 67.3 million). The associated current and non-current leasing liabilities remained virtually unchanged overall.
Other non-current assets, which mainly comprise intangible assets and property, plant and equipment, increased by 13.7% to € 1,325.6 million (from € 1,166.0 million) in the past financial year. The increase is linked to the expansion of investment activities in 2023, following lower investments in non-current assets in previous years. In addition, the acquisition of investment property totaling € 21.1 million contributed to the increase.
As at 31 December 2023, current borrowings include the current proportion of promissory note loans in the amount of € 125.0 million (previous year: € 60.0 million) and short-term bank liabilities amounting to € 20.9 million (previous year: € 15.9 million).
Other current liabilities, which exclusively include the negative market value of derivative financial instruments, increased from € 39.7 million to € 47.7 million compared to the previous year.
Non-current borrowings include promissory note loans totalling € 426.1 million (previous year: € 251.5 million).
Pension provisions remained almost unchanged at € 22.5 million (previous year: € 22.4 million).
Other non-current liabilities amounted to € 40.0 million as at the balance sheet date (previous year: € 44.7 million).