Water and Air
TARGET DESCRIPTION:
- Industry good practice for effluent treatment is met by 90% of core PUMA suppliers with wet-processing facilities
- Industry good practice for air emissions is met by 90% of core PUMA suppliers with significant emissions
- Reduce water consumption at PUMA core suppliers per pair or piece by 15% (based on 2020 baseline)
Relates to United Nations Sustainable Development Goals 6, 14 and 15
EXAMPLES OF THE 10FOR25 ACTION PLAN:
- Ensure regular wastewater testing at relevant suppliers
- Ensure regular air-quality assessments at relevant suppliers
- Support the development of an industry-wide air quality standard
KPIs:
- Percentage of core suppliers meeting good practice standards for wastewater
- Percentage of core suppliers meeting good practice standards for air emissions
- Percentage of water saved per pair/piece
WATER ROADMAP AND RISK ASSESSMENT
In 2021 we developed a water roadmap and conducted a risk assessment using our risk assessment methodology.
WATER ROAD MAP
Below are some key focus areas for the coming years. The measures below are a continuation of the ones started in 2021.
- Raise awareness: As a part of Higg FEM training, we provided training to suppliers on how to improve their score in water and wastewater sections. The cleaner production programmes like Clean by Design (CbD), and PaCT provided support to suppliers to help them reduce water consumption in selected core factories. The targets on water consumption reduction and ZDHC wastewater compliance rate were communicated to the suppliers during supplier meetings. We also reviewed these KPIs in one-to-one meetings with our core suppliers.
- Knowledge of impact: We continued our Life Cycle Assessment (LCA) journey for our top selling products. In 2023 we conducted LCA of three types of sports jerseys made of virgin polyester, PET recycled polyester and RE:FIBRE polyester. We also completed an LCA to compare cotton fabric with a 75/25 blend of virgin and recycled cotton. LCA results are reported under the Products section of this report. As a part of Higg FEM self-assessment the core suppliers and selected noncore suppliers have conducted water risk assessments by using either the WRI Aqueduct Tool or the WWF Water Risk Filter. In 2023, we conducted a waste governance mapping for our top three sourcing countries, summarised their water policy landscape and mapped key local stakeholders. We also conducted a water risk assessment for our wet processing core factories.
- Internal action: Our Material and Development teams continued to launch products with a reduced water footprint. We created a Microsoft excel tool for internal decision making which compares the environmental impact of alternative materials. Our suppliers improved their efforts to recycle treated wastewater, process optimisation, implement rainwater collection etc. to reduce the water footprint in the supply chain. Some of the case studies are presented in this report.
- Collaboration and partnership: We continue to participate in industry-wide cleaner production projects, which include water efficiency measures.
WATER RISK ASSESSMENT
WATER RISK ASSESSMENT AT OUR OWN OPERATIONS
In 2022 we added a water risk mapping for our PUMA sites (offices, stores and logistic centres) globally. Using the WWF Water Risk Filter, we identified 164 sites in areas of water scarcity. For the sites, we identified the water consumption and compared it to the water consumption of similar sites (offices, stores and warehouses separately assessed). We also published an environmental handbook for our entities with recommendations for water-saving measures. In 2023 we followed up with the identified sites and asked for planned or implemented actions on water savings.
At our headquarters in Herzogenaurach, we collect rainwater on our property and use it in the office and the surrounding green area. This helps us reduce our freshwater consumption and water costs.
Most of the other PUMA-operated sites globally are rented and both, rented as well as non-rented, none of the sites use water for industrial processes. Therefore, our ability to reduce water consumption at our sites is limited to using water-efficient kitchen equipment and sanitary facilities.
WATER RISK ASSESSMENT IN THE SUPPLY CHAIN
DETOX.Live is a public disclosure platform operated by ZDHC that provides an overview of suppliers and their input and output control performance, including facility wastewater performance according to ZDHC Wastewater Guidelines. Factory performance, after uploading the test data to ZDHC Gateway Wastewater Module, is shown in three different colour codes on the public DETOX.Live map: green – facility meets the ZDHC requirements, red - facility does not meet requirements, and orange - facility does not meet the requirements but a CAP (Corrective Action Plan) was submitted.
We will use the DETOX.Live platform to check the wastewater performance of new factories that have not connected with PUMA on the ZDHC Gateway. We can know whether new factories have implemented ZDHC Wastewater Guidelines, and what their wastewater performance is like.
PUMA has also adopted ELEVATE intelligence (EiQ), a comprehensive suite of supply chain analytics, to:
- Assess our supply chain risks by geography, commodity and issue.
- Complete a risk assessment for suppliers, factories and sites.
- Manage risks that are material for each supplier, factory or site.
In 2023, we conducted a water risk assessment for 62 wet processing core Tier 1 and Tier 2 factories located in six sourcing countries: Vietnam, China, Bangladesh, Taiwan, Cambodia, Turkey and Indonesia. We used the WWF Risk Filter and WRI Aqueduct. With the WWF Risk Filter, we assessed basin risk covering water scarcity, water quality and regulatory risk. With WRI Aqueduct, we assessed physical risk quantity and quality, as regulatory and reputational risks.
We identified which factories are located in high and very/extremely high-risk areas. Then we looked at their water KPIs, ZDHC wastewater standards conformance, MRSL compliance rate and their water consumption reduction initiatives to mitigate water risks.
Out of 62 wet processing factories, 50 have a high and extremely high-water risk level as per the WRI Aqueduct. Out of these 50 high and extremely high-water risk level factories, 26 have a FEM 2022 water module score higher than PUMA average, 31 factories have MRSL conformance rate higher than the PUMA goal, 35 factories comply with ZDHC wastewater compliance, 15 have water KPIs above PUMA average and 13 factories have wastewater recycling practices. In the coming years, we plan to work with high and extremely high-risk factories that do not have adequate risk mitigation measures in place. These activities will include providing training and support in terms of improving MRSL conformance, corrective action plans for ZDHC wastewater failures, improving Higg FEM water module score, enrolment in resource efficiency programmes where possible, raising awareness of wastewater recycling and implementing water reduction initiatives.
WATER GOVERNANCE
In 2023, we conducted a water governance mapping for our top three sourcing countries, namely Vietnam, China and Bangladesh. We looked at the water policy landscape and identified key stakeholders. Challenges and opportunities in water and wastewater management were also identified for each of the regions. We found that water, wastewater policy and regulations are evolving with stringent requirements being introduced progressively. We also see that interesting water projects are being undertaken in these countries on water reduction and water recycling.
Vietnam has a national strategy on water, regulations on water security, water protection and development. The five countries (Vietnam included) under the Mekong River Commission promote and coordinate the sustainable management and development of water, for the mutual benefit of these countries and their citizens’ well-being through a 2030 strategy. In addition, Vietnam has a national 2030 Water Resource Strategy with a view to 2045. There are some fiscal incentives in place, such as tax reduction or exemption schemes for the effective use of water. There are resource efficiency programmes such as FABRIC programme by GIZ, HSBC water programme, Clean by design by Aii and WWF’s Greater Mekong Delta, Vietnam improvement programme by IFC, and Race to Top by IDH. There is a need for more public-private partnership projects to develop further competence for green business or to encourage green production. There is also a legislation gap related to groundwater withdrawal.
China has an elaborate regulation on water and wastewater. In 2019, the country introduced the Developed National Water Conservation Plan. The fourteenth five-year plan released in 2022 focuses on national water security over the next 100 years, to target flood control and drought relief, utilisation of water resources, optimal allocation of water resources to prevent uneven water distribution and aquatic ecology protection.
Water/resource efficiency improvement programmes launched in China include WWF’s water stewardship programme, GIZ’s FABRIC programme, and the Clean by Design programme by Apparel Impact Initiative. The Institute of Public & Environmental Affairs (IPE) publishes a Water Map, to visualise China’s ground water and drinking water source quality over the years.
China is still having critical issues with the unbalanced distribution of water resources which leads to water stress in specific areas, especially the east of the country where industries are blooming, and the population is rapidly growing.
Bangladesh's latest regulation on water was introduced in 2013 and introduces amendments and new regulations to promote water conservation in the country. Legal frameworks need to be consistent and integrated, and account for all major water impacts and risks within Bangladesh. Falling groundwater tables combined with the projected increased water abstraction rates are likely to threaten industrial production. The cost of developing alternative water sources is substantial and could hinder growth. The country is prone to flooding with a very high-risk rating by the WWF Risk Filter. Water Partnership for Cleaner Textile (PaCT) by IFC and Sweden Textile Water Initiative (STWI) by Stockholm International Water Institute are a few successful resource/water efficiency improvement programmes implemented in the country.
We mapped our core factories in these three countries to evaluate the risks and determine if mitigation measures through our water-related goals and the factories' own initiative address these risks.
In coming years, we will engage with relevant stakeholders to promote water conservation and recycling in these key sourcing countries.
LCA WATER DATA
In 2023, we did an analysis of Life Cycle Assessment (LCA) studies conducted during 2021 to 2023 with a focus on water footprint*. The objective was to come up with an actionable framework for material selection that would reduce our water footprint. Six footwear products, five apparel products, one accessory product** and three types of cotton fabrics were analysed. The outcome is summarised below.
Among the three product divisions, the water footprint of apparel products was the highest, followed by footwear and accessories.
Apparel: We found out that the consumer use phase of apparel products has the highest impact on the total water footprint (44 to 81% of total lifecycle water footprint), which is due to consumers washing garments at home. Since the use phase impact is not under our control, we excluded it from our water footprint analysis. We observed that the fabric dyeing process at Tier 2 factories has a larger water footprint (8 to 29% of the total lifecycle water footprint excluding the use phase) as compared to other manufacturing processes such as spinning, knitting, garment manufacturing and packaging. It was found that the water footprint of cotton is larger than that of polyester material. This is mainly due to the water consumption during cotton cultivation. This also explains why recycled cotton has a smaller water footprint than virgin cotton. From a water impact perspective, recycled polyester appears to be the best option. The analysis indicates that selecting materials with less water impact such as recycled cotton and polyester and materials made of Better Cotton fibre helps to reduce our water footprint. Better Cotton helps farmers to use water in a way that is environmentally sustainable, economically beneficial and socially equitable. This water stewardship approach can improve crop yields, strengthen resilience to climate change, minimise negative impacts on water quality and enable fair water access for all users in a catchment area. The analysis also indicates that we should focus on improving the water efficiency of the dyeing mills. This could include the installation of low-water ratio dyeing machines, waterless dyeing machines and recycling of wastewater.
Footwear: The Life Cycle Assessment (LCA) of footwear highlights the various environmental implications connected with various materials and phases of manufacture. Notably, Ethyl Vinyl Acetate (EVA) which is generally used as a midsole, appears to be a low water footprint substance, providing a better option. Polyurethane (PU), leather, and natural rubber, on the other hand, have larger water footprints. This calls for our innovation and material team to focus on having more recycled materials such as recycled polyester, recycled PU, recycled rubber and recycled EVA. We mainly source leather from tanneries which are LWG certified. In 2021 LWG released a new version of the LWG audit standard, bringing major changes to how they assess leather manufacturers, this will help to further reduce the water footprint of leather footwear products.
*Water Footprint is expressed in terms of blue water consumption (BWC), which means freshwater consumption sourced from surface and ground water
**Since there is only one accessory product for which the LCA was conducted so far, there was not enough data to compare among accessories materials and reach a conclusion. Hence, the analysis on accessory materials was excluded from the above description.
MRSL WASTEWATER TESTING
Since 2015 we have increased the number of wastewater tests from 33 to 153 factories and in 2023 we received 276 Wastewater test reports. 97% of all factories with wet-processing facilities (157 factories have wet processes) have been covered by tests, and tests show that all these factories have at least a 90% compliance rate with the ZDHC Wastewater Guidelines (Foundational level). ZDHC has created a three-level approach to the limits for heavy metals and conventional parameters to promote continuous improvement. The limits get more stringent as they move from Foundational, Progressive to Aspirational levels.
All 153 suppliers have a ZDHC ClearStream report. ClearStream report, an easy-to-read facility performance report of ZDHC wastewater conformance, is automatically generated on the ZDHC gateway platform. To obtain a ZDHC ClearStream report, the factories must conduct wastewater testing following the ZDHC Wastewater Guidelines at one of ZDHC Accepted Laboratories, and all test results must be uploaded to the ZDHC Gateway Platform by the laboratory.
Out of 153 factories, 117 factories are fully compliant with all ZDHC Wastewater Guidelines requirements. Where a wastewater test failed, we helped factories to conduct a root cause analysis and create corrective actions for wastewater and sludge, using the industry standard template. In 2023, we followed up with those factories that failed to fully comply with the Wastewater Guidelines, and received ten corrective action plans. We will continue to follow up through 2024 to obtain corrective action plans and we will evaluate further measures that need to be taken. We will also follow up on their implementation through wastewater testing in 2024.
In 2023 we partnered with an accredited third-party laboratory to organise training on chemical management and wastewater conformance, as well as root cause analysis and corrective actions for non-conformance. Case studies of conventional parameter failures have been presented in the training.
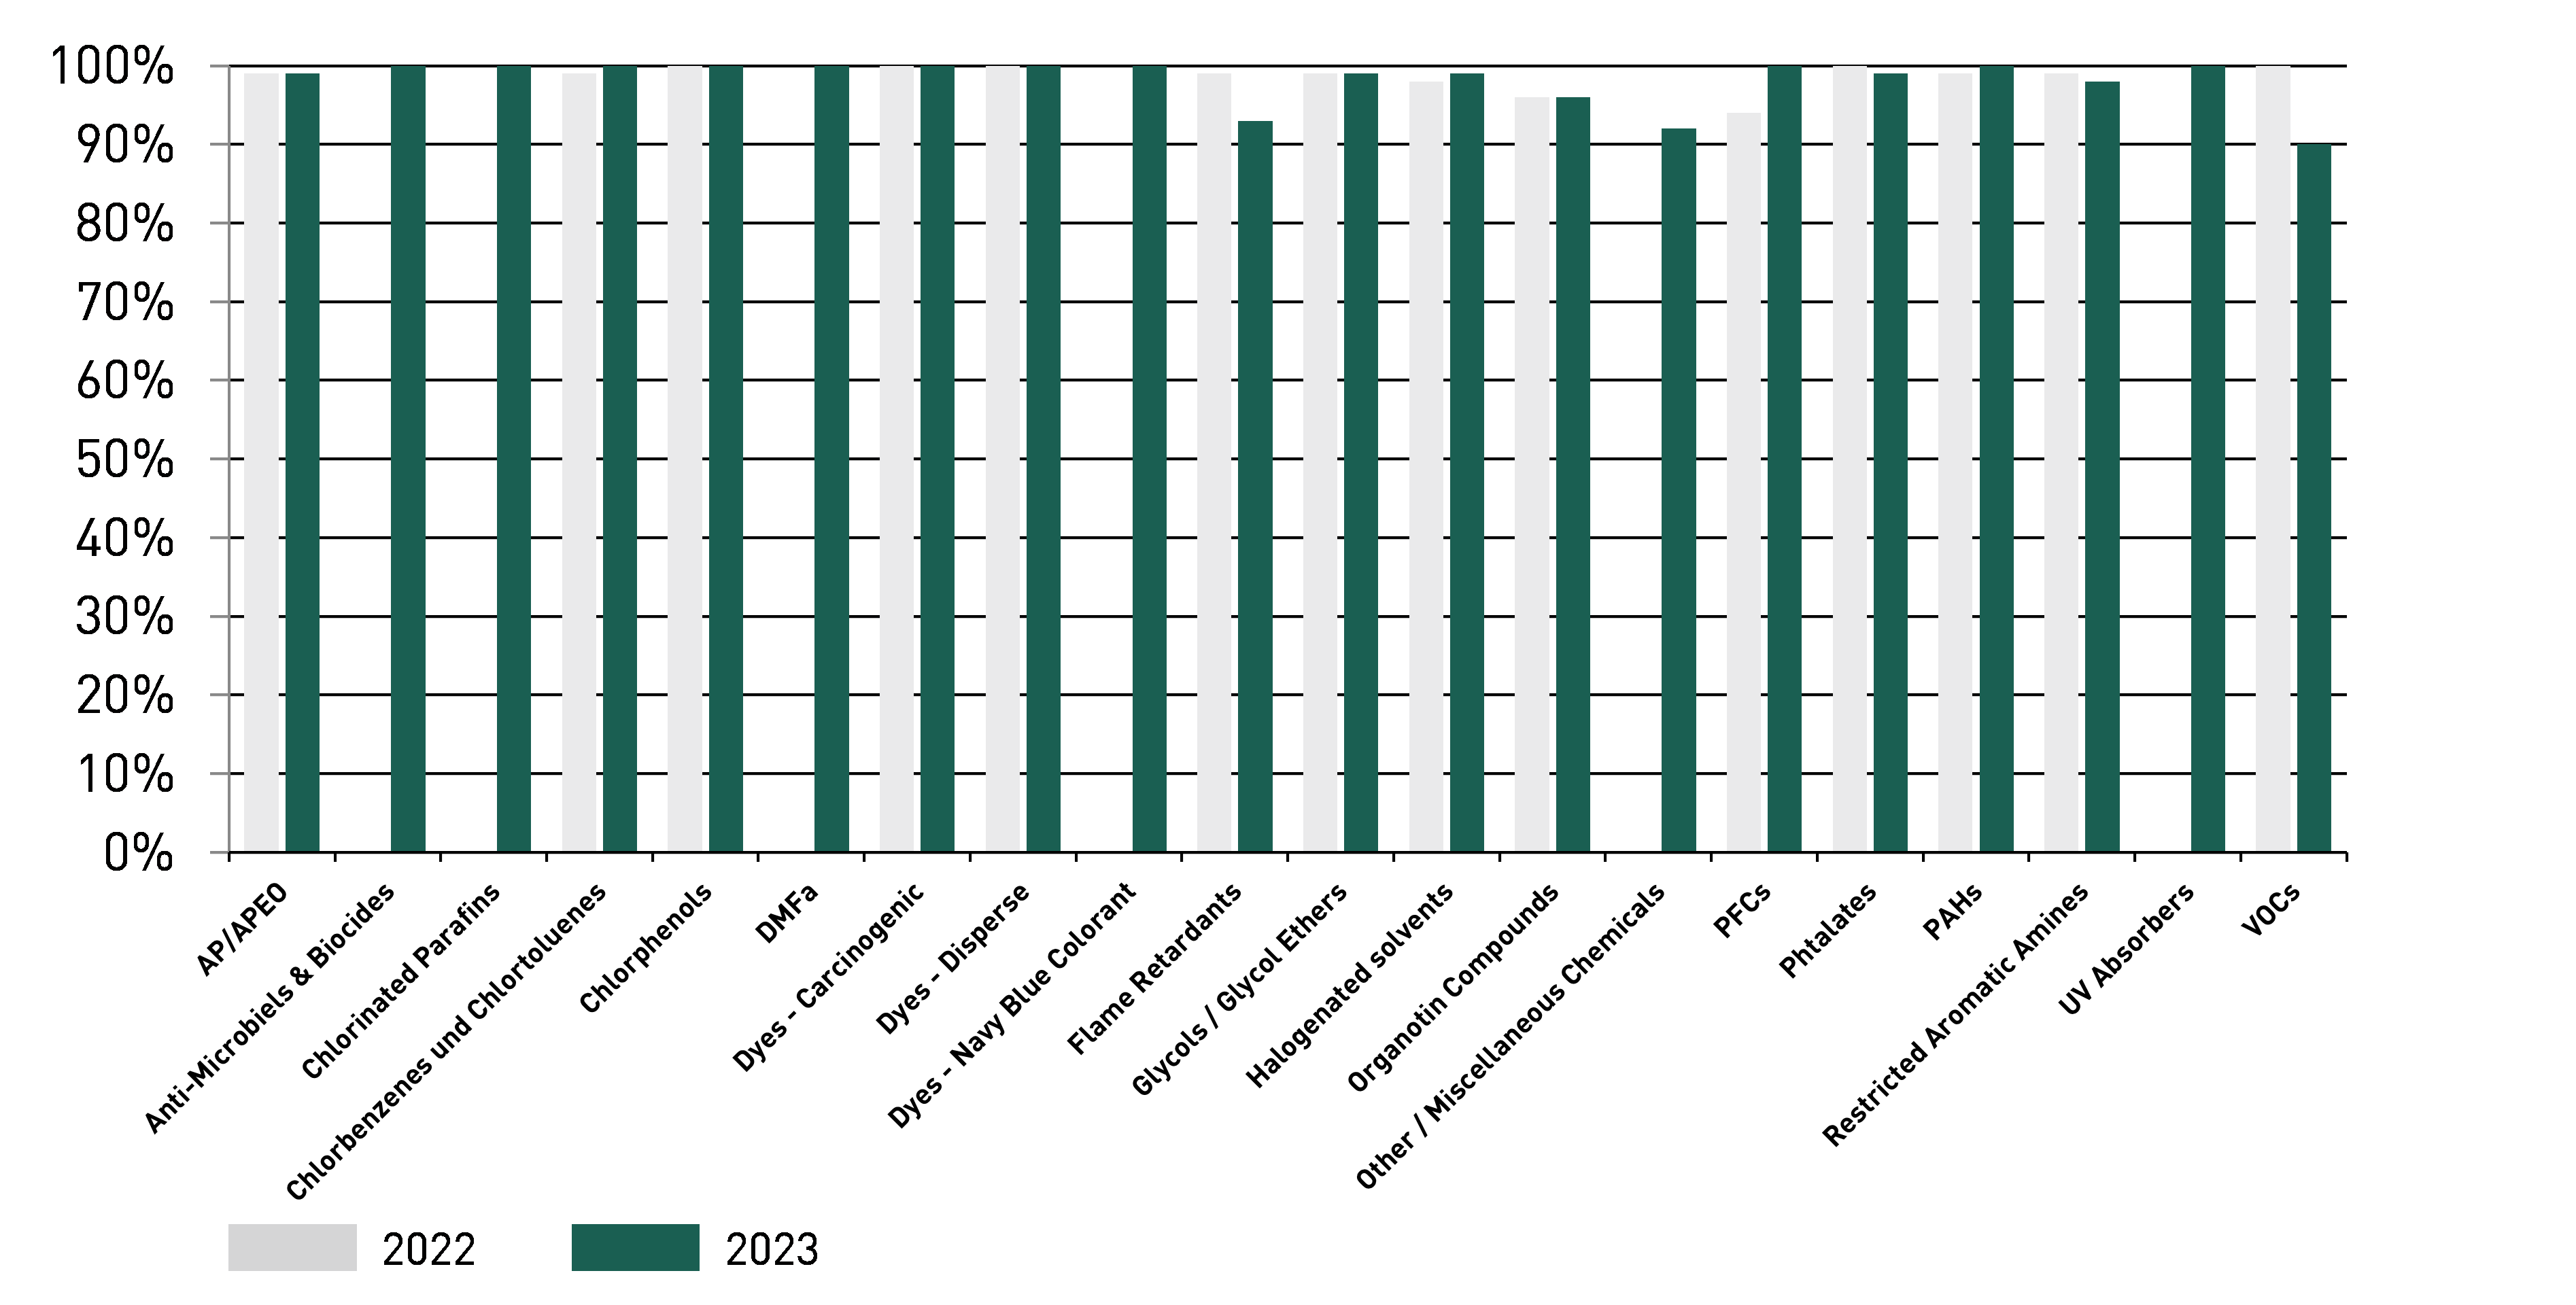
The overall compliance rate for each category is:
- Conventional wastewater parameters: 99%
- Heavy metals: 99%
- Restricted chemicals (MRSL): 98%
The overall compliance rate for conventional parameters increased by 1% in 2023 as compared to 2022, the compliance rate for heavy metals was maintained at 99%, and the compliance rate for restricted chemicals has fallen by 1%. The reason for the lower compliance rate for restricted chemicals this year is that 50% of the factories do not comply with new substances listed in ZDHC Wastewater Guidelines Version 2.1, which is a new version that came into effect in 2023.
The conventional wastewater parameters, apply only to suppliers which discharge their wastewater directly into natural water bodies. Test results show over 90% compliance with the ZDHC Wastewater Guidelines (Foundational level). For heavy metals and restricted substances, the test results also show over 90% compliance for each parameter with the ZDHC Wastewater Guidelines. This means we have achieved our wastewater quality target as a part of our 10FOR25 sustainability goals.
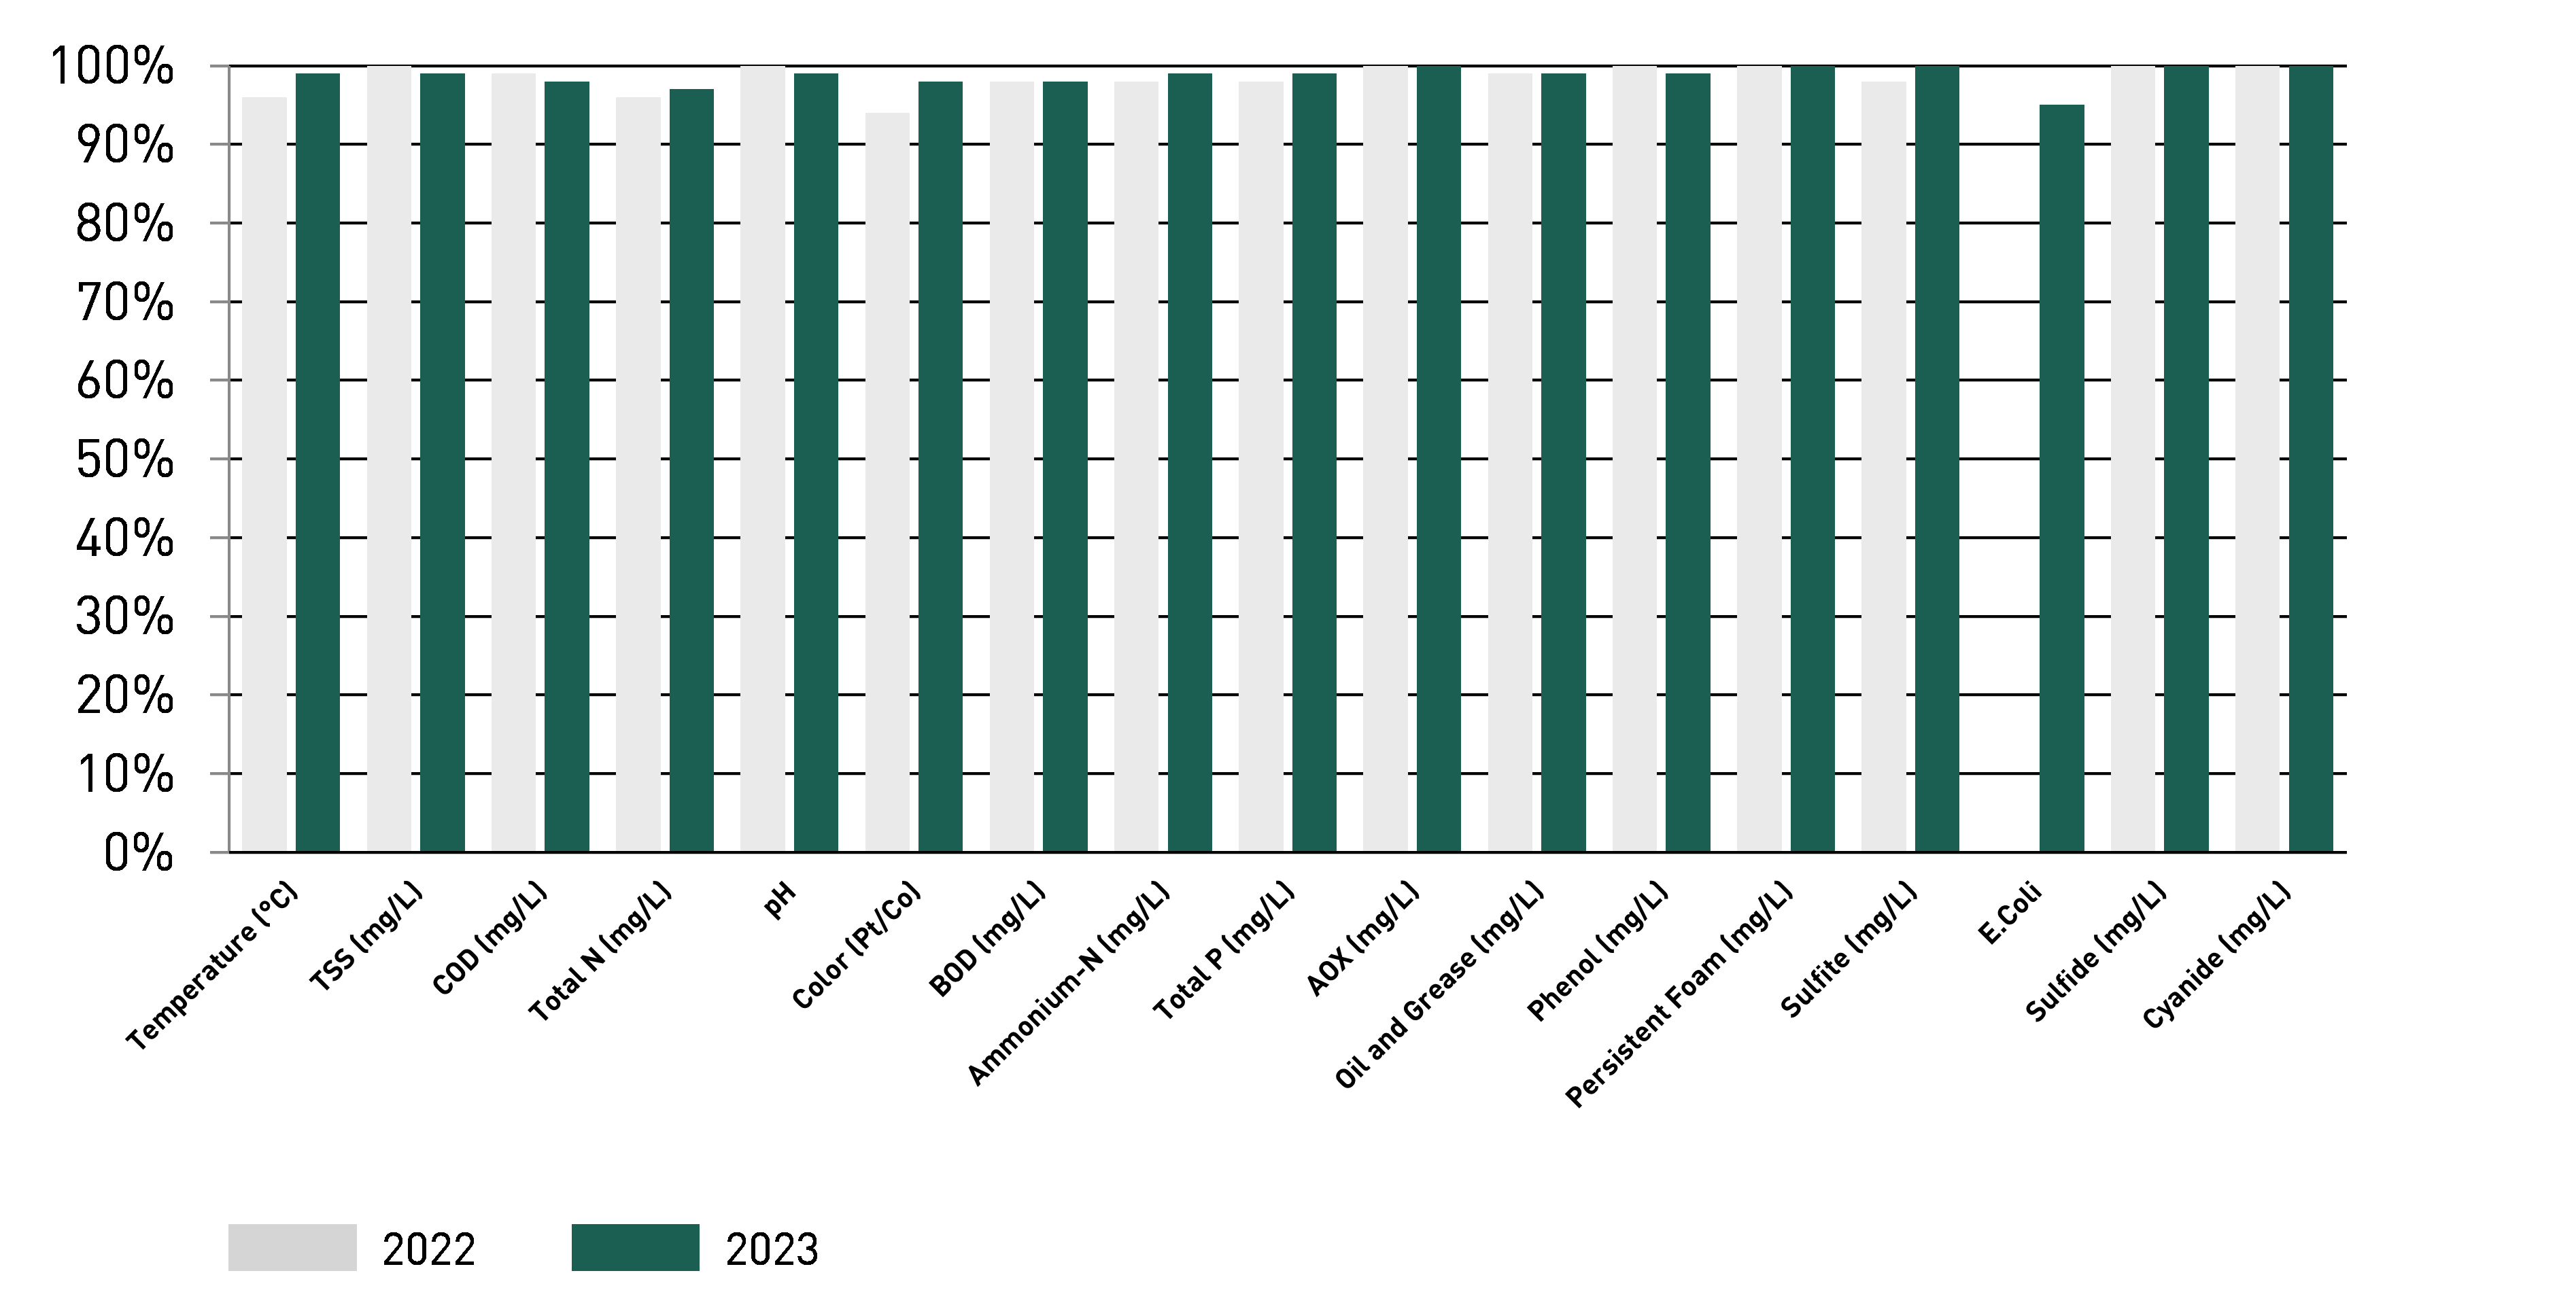
↗ G.27 performance against ZDHC Wastewater Quality Guideline – Heavy Metals
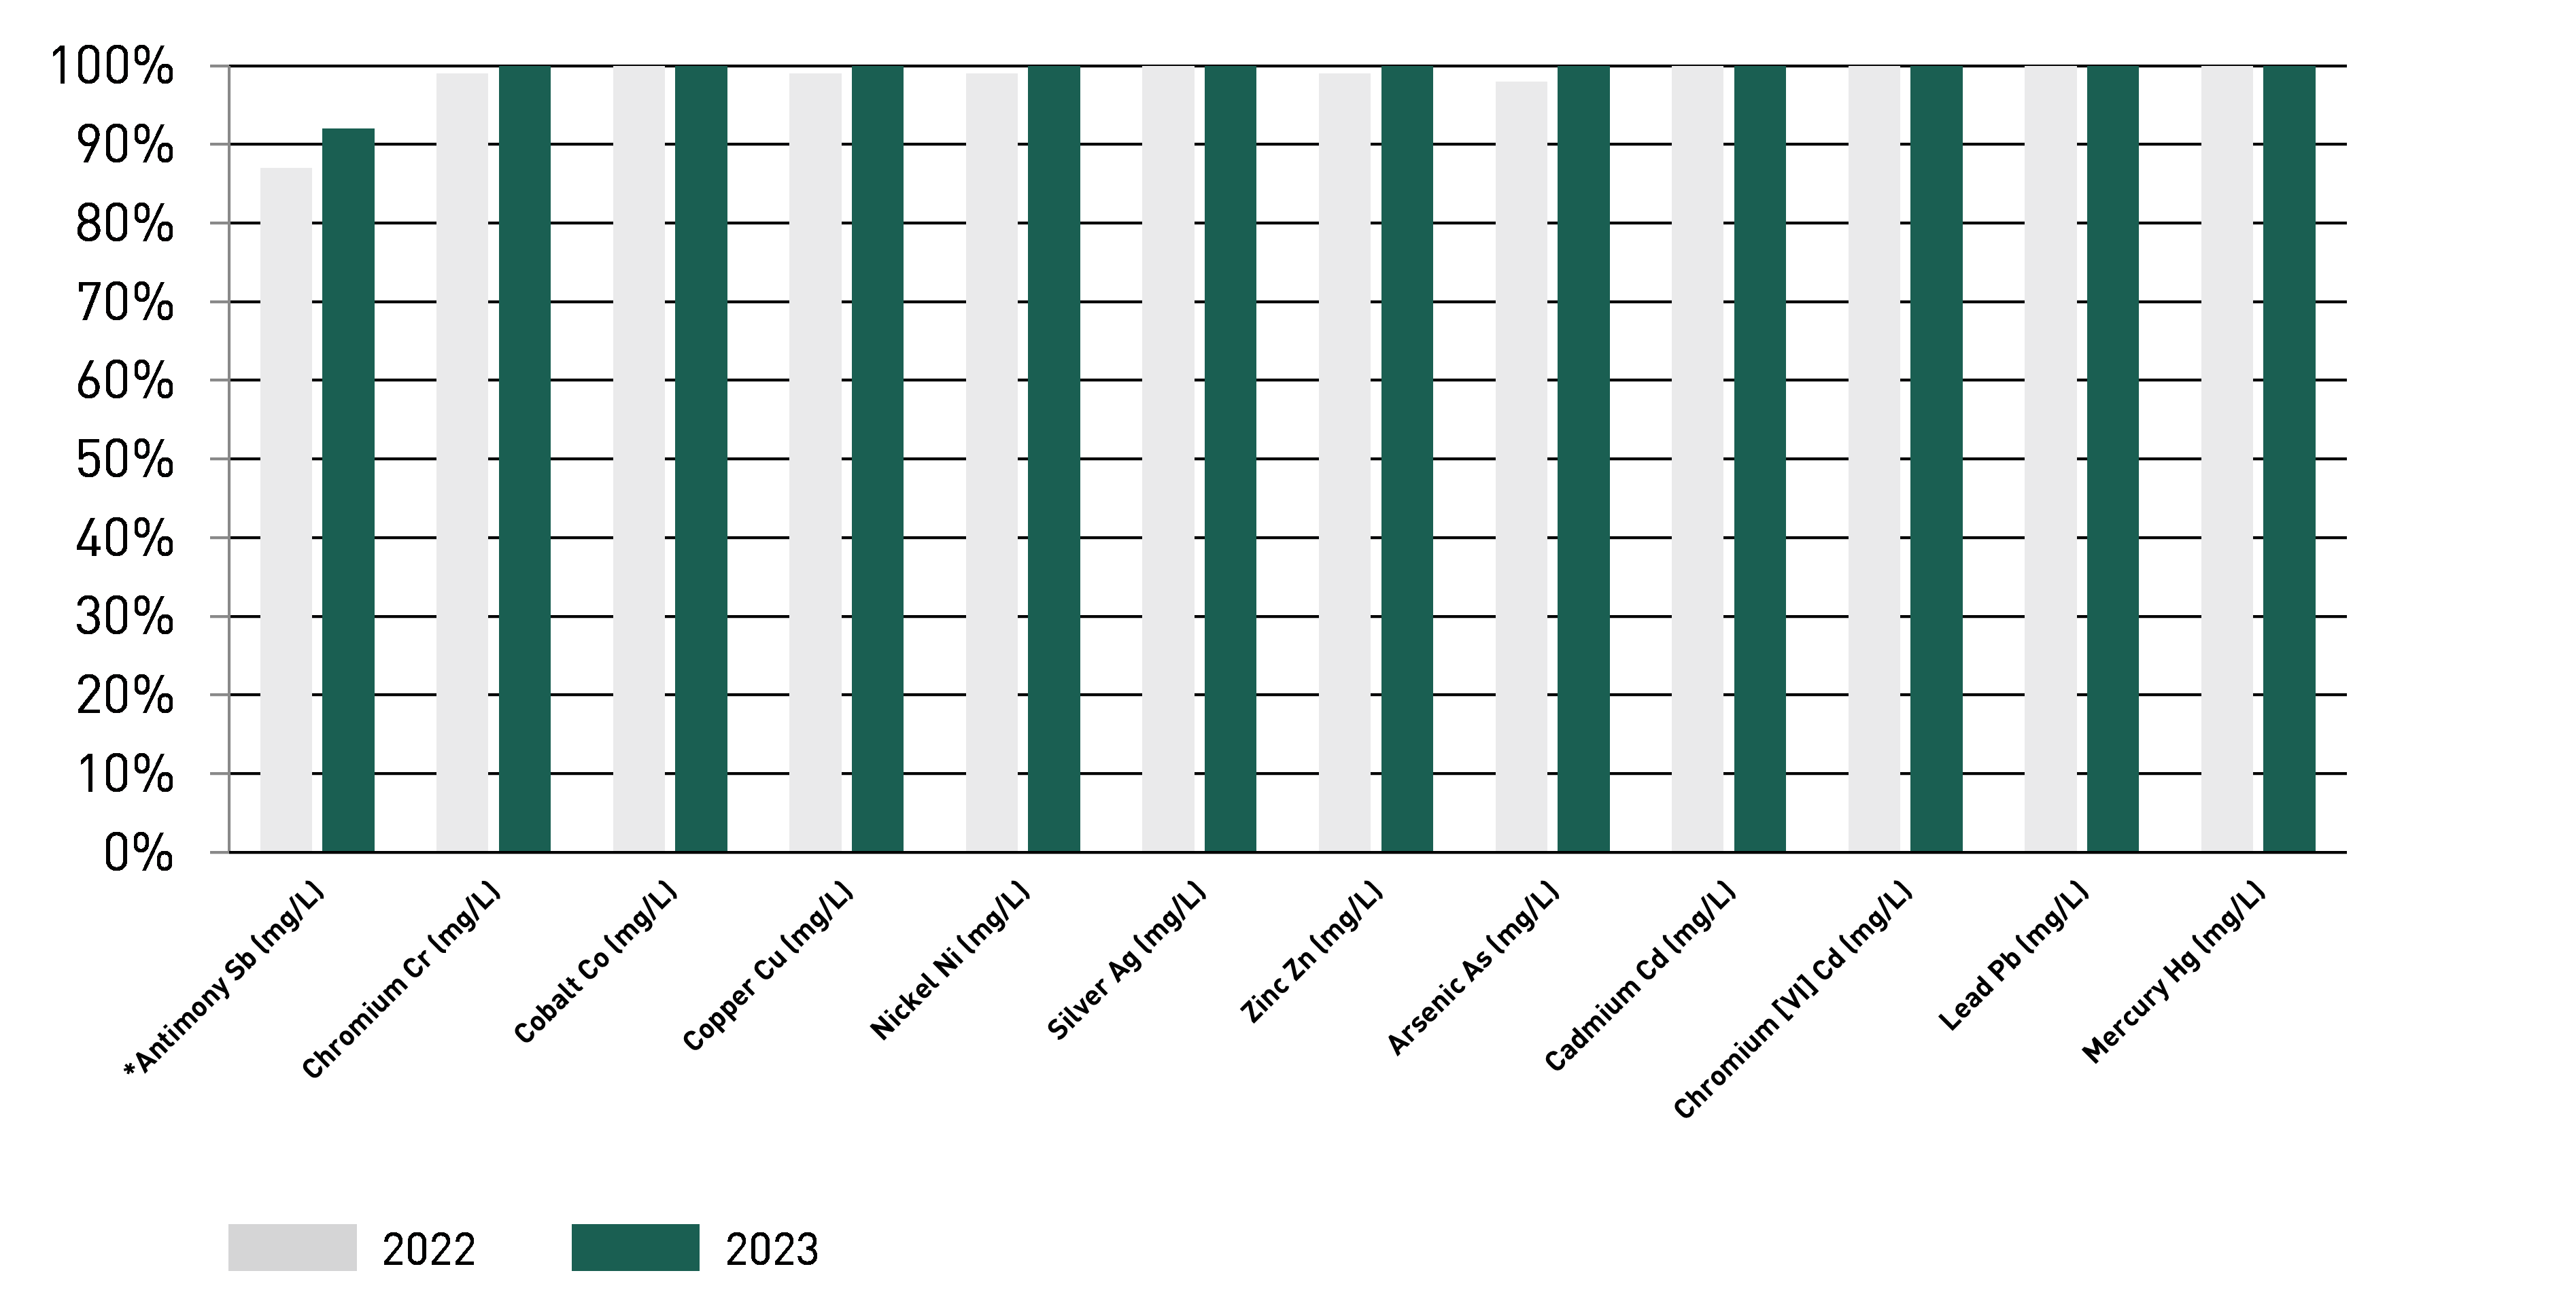
*Antimony is subject to an exemption for mills that produce or dye polyester fabric because the antimony is used as a catalyst for polyester production and it is natural to have antimony in the wastewater. This is acceptable as per ZDHC Guidelines.
↗ G.28 PERFORMANCE against ZDHC WASTEWATER QUALITY GUIDELINE – RESTRICTED CHEMICALS
SUPPLIER TRAINING
To help our suppliers better understand the requirements set by PUMA and the industry, we trained suppliers in standards, guidelines, tools as well as methodology for nonconformance investigation and remediation. Case studies of restricted chemicals and heavy metal parameter failures were used in the training.
Training scope | Topics | Number of factories | Number of participants | % factories trained* | |
ZDHC Wastewater and Root Cause Analysis & Corrective Actions | All Tier 1 and core Tier 2 with wet processing | ZDHC WW guidelines V 2.0 and implementation | 95 | 182 | 61% |
|
|
|
|
|
|
*% of factories joined the training, based on the total number of factories in the scope for this training. 61% of factories participated in the training as some of the factories are aware of these requirements and methodologies and hence did not join the training.
In 2023, we partnered with an accredited third-party laboratory to organise a “Chemical Management on Wastewater Conformance Updates Training and Root Cause Analysis/Corrective Actions” for suppliers not conformant with the ZDHC Wastewater. Case studies of conventional parameter failures were used in the training.
A total of four training sessions were conducted in three different languages. More than 180 participants from 95 factories joined. More than 90% of participants were satisfied with the training arrangement and content.
The training helped the factories’ participants to understand the new ZDHC Wastewater Guidelines, along with implications and impacts on their facility of the key updates. It also clarified how to conduct a Wastewater Root Cause Analysis and take Corrective Actions in the event of a non-compliant test result.
After the training, the factories which were not compliant with the ZDHC Wastewater Guidelines, were required to conduct a Wastewater Root Cause Analysis and provide Corrective Actions. We received ten Corrective Action Plans from ten factories. We will follow up on their implementation through wastewater testing in 2024.
In addition, we encouraged suppliers’ chemical management teams to attend in-depth training courses as part of the ZDHC Academy, which is conducted by ZDHC-approved service providers.
WATER SAVING
In 2023, we expanded the participation of our core Tier 1 and Tier 2 suppliers in cleaner production programmes to improve energy and water efficiency.
Below are the annual savings from completed and ongoing projects between 2019 and the end of 2023:
- Greenhouse gas reduction: 90,182 tCO2e per year
- Renewable energy: 247 MWp of RE capacity (including offsite wind) added in 2021, 2022 and 2023
- Water saving: 2,401,002 m3 per year
- Energy saving: 177,168 MWh per year
Apart from our 10FOR25 targets, we have set a target to reduce water consumption by 15% per unit of products manufactured in 2025 compared to the 2020 baseline.
For further data on water consumption, please refer to the Environmental Key Performance Data section of this report.
↗ G.29 PUMA CDP WATER SCORE
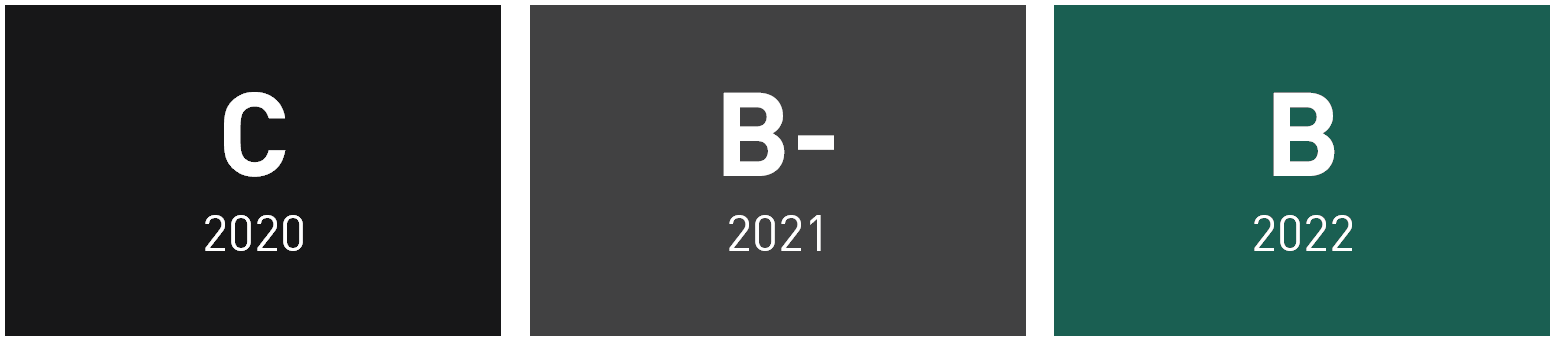
PUMA’s CDP water score improved from B- in 2021 to B in 2022. Until the end of January, 2024 we retained our B score. For more information, please visit the CDP website.
Water reduction at two suppliers Tai Hing Zipper, introduced an innovative wastewater treatment and recycling plant for its dying system in 2022 with an investment of $ 800,000. This advanced biological treatment along with a water recycling plant, helps in conserving 90% of water for every kilogram of fabric. From its early stage of implementation to the present, water usage and wastewater output have been significantly optimised. Previously, consuming 100 m3 of water per day in the dyeing workshop, the factory has progressively reduced its water consumption to an average of 10 m3 per day for the same production volume. The factory has adopted an innovative technology called the A/O process for the treatment of wastewater generated from its dyeing operation. This allows for the recycling of the treated wastewater back into the dyeing process. The factory has also installed a chemical index monitor to facilitate the monitoring of the treated wastewater quality. SQUARE Fashions Limited (SFL), a vertically integrated readymade garments manufacturing company has placed significant emphasis on sustainability and environmental responsibility. To further enhance these goals, SFL implemented various measures in 2023 to reduce its impact on water. These include the installation of a water reclamation plant, rainwater harvesting systems, reuse of steam condensate water, process optimisation, reuse of machine cooling water and raising awareness amongst employees. These initiatives resulted in a reduction of 36.3% as compared to 2022 in groundwater consumption. This accounts for an absolute annual saving of 1,128,755 m3 and a financial savings of 10 million BDT ($ 97,785) in 2023. |
2023 | 2022 | 2021 | 2020 | 2019 | 2018 | Change 2020/2023 | |
Total Water from own operations (m³) | 142,565 | 147,227 | 116,829 | 96,569 | 89,767 | 95,291 | 47.6 % |
Public network consumption (m³) | 137,651 | 143,332 | 116,829 | 96,569 | 89,767 | 95,291 | 42.5 % |
Rainwater consumption (m³) | 4,914 | 3,895 | |||||
Total Water from PUMA production (core Tier 1&2) (k m³) | 7,322 | 8,507 | 8,475 | 7,128 | 2,572 | 2,030 | 2.7 % |
Total Water from PUMA production (Tier 1) (k m³) | 2,157 | 2,551 | 2,706 | 2,332 | 2,572 | 2,030 | -7.5 % |
Total Water from PUMA production (Tier 2) (k m³) | 5,164 | 5,956 | 5,769 | 4,796 | 7.7 % | ||
|
|
|
|
|
|
|
|
1 Figures include PUMA owned or operated offices, warehouses and stores. Includes our own production sites in Argentina. All other production is outsourced to independent supplier factories, some warehouse operations are outsourced to independent logistics providers. Franchised stores are excluded.
2 Data includes extrapolations or estimations where no real data could be provided
3 Methodological changes over the last three years have influenced results
4 PUMA Production (Tier 1) includes core Tier 1 supplier factories, Apparel, Footwear & Accessories (54 factories)
5 PUMA Production (core Tier 2) includes core Tier 2 supplier factories, Leather, PU & Textiles (40 factories)
6The values for November and December 2023 were estimated by employing the Exponential Smoothing (ETS) algorithm in Microsoft Excel, utilizing data from January to October of 2023. This approach was chosen after comparing it to alternative methods, considering its performance against actual historical data, specifically in terms of deviation from the actual values in percentage terms. The ETS method displayed both higher accuracy and higher precision compared to other methods, such as averaging the last 10/12 months or multiplying the estimated production by the average KPI (per production unit) from the 12 months of data spanning from November 2021 to October 2022.
Although we do not have any goal for absolute reduction in water consumption from our core suppliers, we continue to track their water consumption. In 2023, the absolute water consumption has decreased by 7.5% for Tier 1 suppliers, as compared to the baseline of 2020. This is achieved due to a decrease in production volume for apparel by 15% and an improvement in water usage efficiency per pair of footwear by 21.5% during the same period.
For Tier 2 suppliers, absolute water consumption has increased by 7.7% compared to the baseline of 2020, despite a significant increase in production volume in all Tier 2 divisions (12% for textiles, 7.3% for leather, and 171% for PU). It is worth noting that water usage efficiency at textile production, the highest contributor to water usage, has improved by 4.9% (from 103 to 98.3 m3/ton of fabric), due to the water-saving measures taken by the suppliers including the installation of water recycling plants by some suppliers towards end of 2022. The increased usage of recycled materials such as recycled cotton and recycled polyester has also contributed to less water consumption.
AIR EMISSION
Air emission at our own operationS
In terms of air emissions, there are no significant air emissions to report from our own sites. We have outsourced all manufacturing to external manufacturing partners and at our largest sites globally we do not have any industrial processes which could create air emissions. The only exception is our own manufacturing site in Argentina, which is covered by our supply chain efforts listed below.
For our largest site, our global headquarters, we use district heating and heat pumps for heating, resulting in zero direct air emissions from the building. This fact was confirmed during our ISO 14001 certification audit in 2022.
Air emission in our supply chain
Since the publication of the ZDHC Air Emission Guidelines was still not been finalised in 2023, we decided to internally monitor our core supply chain’s performance regarding air emissions. We designed a set of questionnaires to gather the relevant air emission compliance information for our 131 core factories (Tier 1 and Tier 2), towards local regulations (samples are selected by the factories and tested towards the requirements provided by the local environmental authorities).
The result shows that 100% of the core factories sampled were compliant with the local regulation for air emission in 2023.
ZDHC AIR EMISSION guidelines pilot
In 2023, ZDHC circulated a draft air emission guideline V1.0 to the Air Emissions Task Team for review. We tested the draft guideline in our supply chain through a pilot study. The objective was to evaluate suppliers' readiness to comply with ZDHC draft guidelines and to provide feedback for review by the Task Team.
We partnered with a third-party laboratory, Eurofins MTS, to collect chemical samples and conduct tests from six factories in Vietnam and two factories in China, out of which four are footwear factories and four are apparel factories. The tests include the measurement of total VOCs (TVOCs) and calculate the Potential to Emit (PTE), using the methodology referenced in the draft guidelines. We will share this data with ZDHC to help establish the Foundational limit value for TVOCs in the guidelines. We also tested Hazardous Air Pollutants/Toxic Air Pollutants (HAP/TAP). Out of 833 collected chemical samples, we detected HAP/TAP in 132 samples accounting for around 15.8% of total samples. Further breakdown indicates 13.2% of samples are from footwear factories and 2.6% are from apparel factories. However, these factories have a high MRSL conformance rate which is verified by a third party and they provide appropriate personal protective equipment to their workers. ZHDC has not yet specified any limits for these air pollutants in the draft guidelines.
We also collected air emission samples from three factories (one apparel Tier 2, one footwear Tier 1, one footwear Tier 2) to test the air pollutants. Tests included air pollutants from point sources i.e. combustion of fuels and fugitive emissions from the production processes as per the draft guideline. The draft guidelines do not yet specify any limits for World Health Organization (WHO) pollutants like Particulate Matter (PM), Nitrous Oxides (NOx) Sulphur Oxides (SOx), and Ozone and globally regulated air pollutants like Carbon Monoxide (CO) and Volatile Organic Compounds (VOCs); they will be incorporated into future updates to the guidelines. In the absence of ZDHC limits, these results were compared with local regulation limits wherever available, and the test results show 100% compliance.
We will communicate the test results with the factories and work to identify the root causes of test results with high values. We will also discuss our results with ZDHC to find solutions on how to address high values, particularly for TVOCs in footwear factories.
Note: Since we are following Greenhouse Gas protocol for Greenhouse gas estimation, the calculation of greenhouse gas was excluded from the scope of this pilot study.